| Red | Green | Blue | |
| z | 17.64 | ||
| znorm | Inf | ||
| sky | -Inf | -Inf | -Inf |
| S/N | 25.9 | 46.0 | 47.4 |
| S/N(c) | 0.0 | 0.0 | 0.0 |
| SN(E/C) |
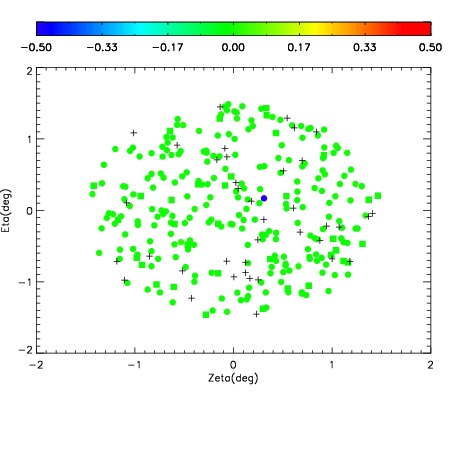
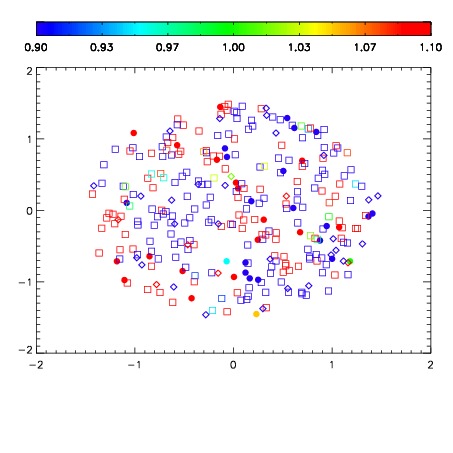
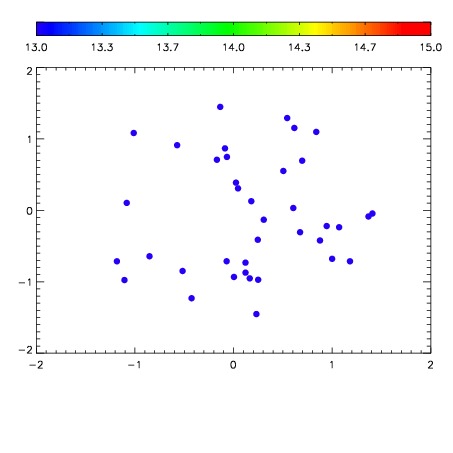

| Frame | Nreads | Zeropoints | Mag plots | Spatial mag deviation | Spatial sky 16325A emission deviations (filled: sky, open: star) | Spatial sky continuum emission | Spatial sky telluric CO2 absorption deviations (filled: H < 10) | |||||||||||||||||||||||
| 0 | 0 |
|
|
|
|
|
|
| IPAIR | NAME | SHIFT | NEWSHIFT | S/N | NAME | SHIFT | NEWSHIFT | S/N |
| 0 | 06070064 | 0.479372 | 0.00000 | 19.0116 | 06070062 | 0.000377952 | 0.478994 | 19.0470 |
| 1 | 06070060 | 0.478016 | 0.00135601 | 19.0306 | 06070061 | -0.00187504 | 0.481247 | 19.0636 |
| 2 | 06070059 | 0.477890 | 0.00148198 | 19.0056 | 06070058 | 0.00000 | 0.479372 | 18.9997 |
| 3 | 06070063 | 0.479340 | 3.20077e-05 | 18.9932 | 06070065 | -0.00167176 | 0.481044 | 18.9932 |