| Red | Green | Blue | |
| z | 17.64 | ||
| znorm | Inf | ||
| sky | -Inf | -Inf | -Inf |
| S/N | 24.7 | 41.5 | 45.5 |
| S/N(c) | 0.0 | 0.0 | 0.0 |
| SN(E/C) |

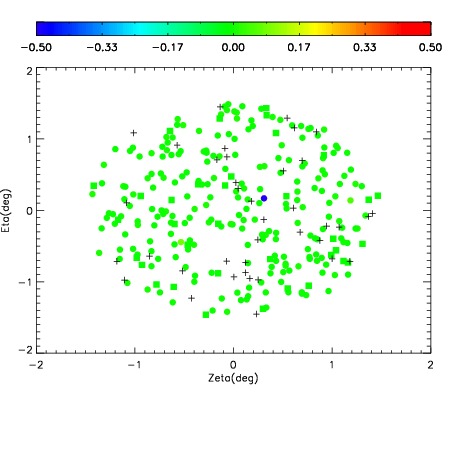
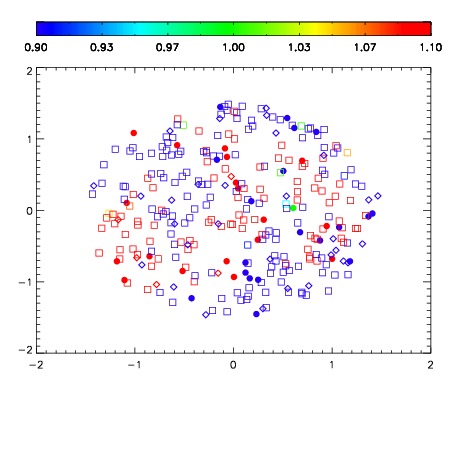
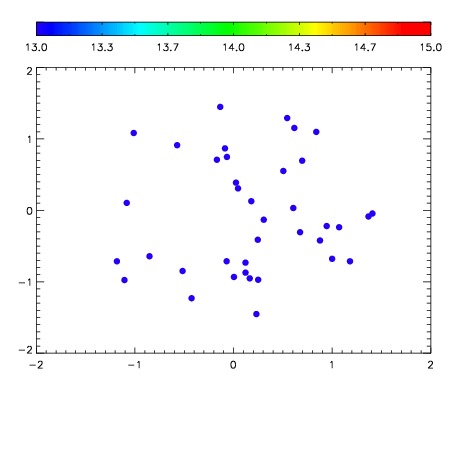

| Frame | Nreads | Zeropoints | Mag plots | Spatial mag deviation | Spatial sky 16325A emission deviations (filled: sky, open: star) | Spatial sky continuum emission | Spatial sky telluric CO2 absorption deviations (filled: H < 10) | |||||||||||||||||||||||
| 0 | 0 |
|
|
|
|
|
|
| IPAIR | NAME | SHIFT | NEWSHIFT | S/N | NAME | SHIFT | NEWSHIFT | S/N |
| 0 | 06110075 | 0.487918 | 0.00000 | 17.8375 | 06110076 | 0.00194317 | 0.485975 | 16.5794 |
| 1 | 06110071 | 0.486485 | 0.00143299 | 19.2177 | 06110072 | 0.000485171 | 0.487433 | 19.2401 |
| 2 | 06110070 | 0.485856 | 0.00206199 | 19.1604 | 06110073 | 0.00220392 | 0.485714 | 19.2021 |
| 3 | 06110074 | 0.485903 | 0.00201499 | 18.5518 | 06110069 | 0.00000 | 0.487918 | 19.1633 |