| Red | Green | Blue | |
| z | 17.64 | ||
| znorm | Inf | ||
| sky | -Inf | -Inf | -Inf |
| S/N | 20.1 | 37.1 | 38.0 |
| S/N(c) | 0.0 | 0.0 | 0.0 |
| SN(E/C) |
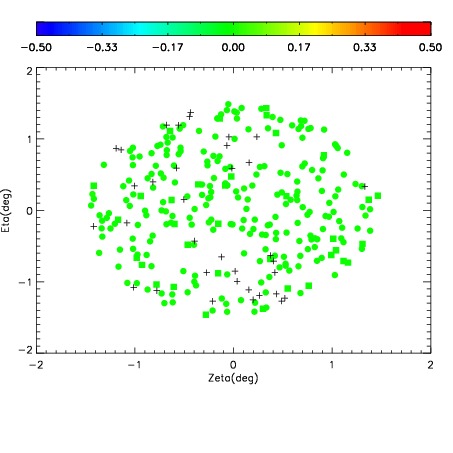
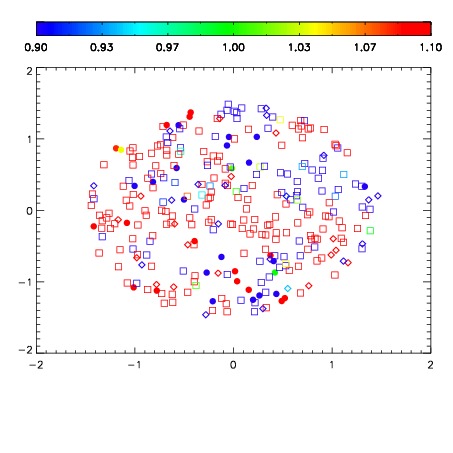
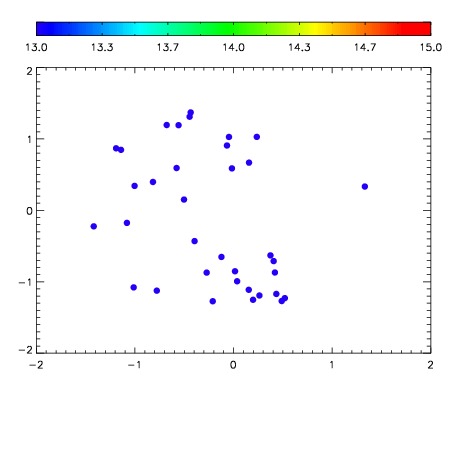

| Frame | Nreads | Zeropoints | Mag plots | Spatial mag deviation | Spatial sky 16325A emission deviations (filled: sky, open: star) | Spatial sky continuum emission | Spatial sky telluric CO2 absorption deviations (filled: H < 10) | |||||||||||||||||||||||
| 0 | 0 |
|
|
|
|
|
|
| IPAIR | NAME | SHIFT | NEWSHIFT | S/N | NAME | SHIFT | NEWSHIFT | S/N |
| 0 | 06080059 | 0.484119 | 0.00000 | 18.7279 | 06080058 | 0.00000 | 0.484119 | 18.7236 |
| 1 | 06080064 | 0.479775 | 0.00434399 | 18.6030 | 06080065 | -0.00524867 | 0.489368 | 18.7079 |
| 2 | 06080060 | 0.482856 | 0.00126299 | 18.5809 | 06080062 | -0.00545311 | 0.489572 | 18.5553 |
| 3 | 06080063 | 0.479796 | 0.00432301 | 18.2537 | 06080061 | -0.00355013 | 0.487669 | 18.5500 |