| Red | Green | Blue | |
| z | 17.64 | ||
| znorm | Inf | ||
| sky | -Inf | -Inf | -Inf |
| S/N | 34.8 | 55.7 | 59.6 |
| S/N(c) | 0.0 | 0.0 | 0.0 |
| SN(E/C) |

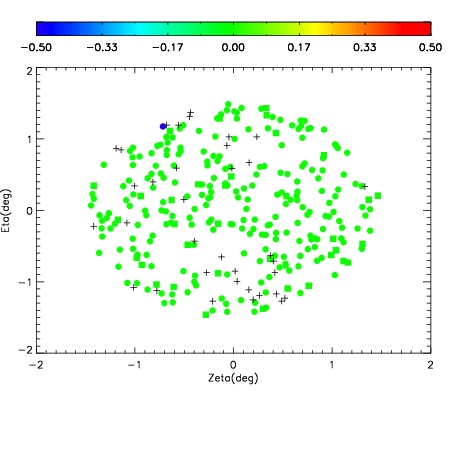

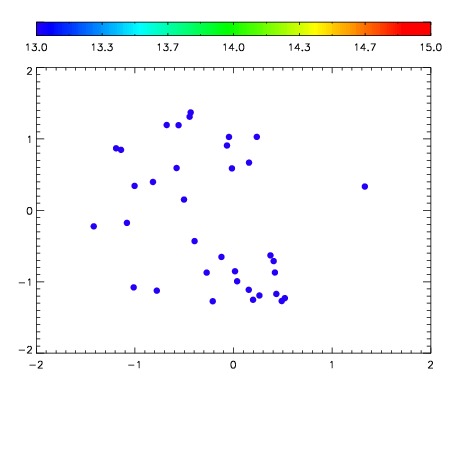

| Frame | Nreads | Zeropoints | Mag plots | Spatial mag deviation | Spatial sky 16325A emission deviations (filled: sky, open: star) | Spatial sky continuum emission | Spatial sky telluric CO2 absorption deviations (filled: H < 10) | |||||||||||||||||||||||
| 0 | 0 |
|
|
|
|
|
|
| IPAIR | NAME | SHIFT | NEWSHIFT | S/N | NAME | SHIFT | NEWSHIFT | S/N |
| 0 | 06130017 | 0.485457 | 0.00000 | 19.1825 | 06130011 | 0.00000 | 0.485457 | 19.1663 |
| 1 | 06130013 | 0.484146 | 0.00131100 | 19.2583 | 06130014 | 0.00161832 | 0.483839 | 19.2501 |
| 2 | 06130012 | 0.483737 | 0.00172001 | 19.2328 | 06130015 | 4.46595e-05 | 0.485412 | 19.2006 |
| 3 | 06130016 | 0.483977 | 0.00148001 | 19.2180 | 06130018 | -0.00214331 | 0.487600 | 19.1760 |