| Red | Green | Blue | |
| z | 17.64 | ||
| znorm | Inf | ||
| sky | -Inf | -Inf | -NaN |
| S/N | 31.7 | 52.7 | 57.9 |
| S/N(c) | 0.0 | 0.0 | 0.0 |
| SN(E/C) |
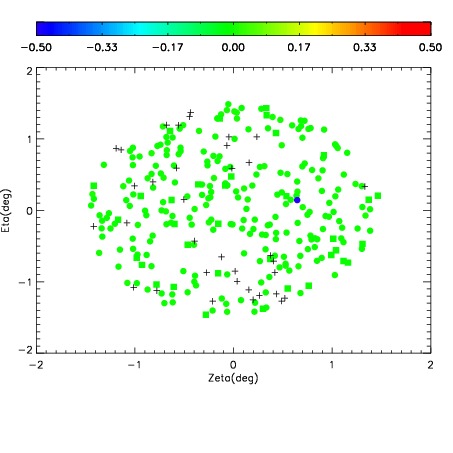
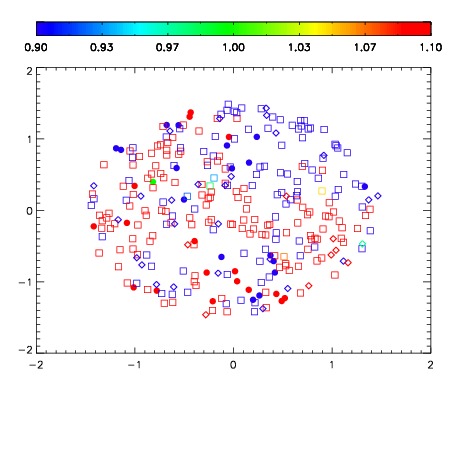


| Frame | Nreads | Zeropoints | Mag plots | Spatial mag deviation | Spatial sky 16325A emission deviations (filled: sky, open: star) | Spatial sky continuum emission | Spatial sky telluric CO2 absorption deviations (filled: H < 10) | |||||||||||||||||||||||
| 0 | 0 |
|
|
|
|
|
|
| IPAIR | NAME | SHIFT | NEWSHIFT | S/N | NAME | SHIFT | NEWSHIFT | S/N |
| 0 | 06380032 | 0.475388 | 0.00000 | 18.9874 | 06380033 | -0.000217229 | 0.475605 | 19.0093 |
| 1 | 06380035 | 0.474063 | 0.00132498 | 19.2124 | 06380037 | 0.000983351 | 0.474405 | 19.2337 |
| 2 | 06380036 | 0.474016 | 0.00137198 | 19.1959 | 06380034 | 0.0134269 | 0.461961 | 19.1115 |
| 3 | 06380027 | 0.475310 | 7.79927e-05 | 19.0332 | 06380026 | 0.00000 | 0.475388 | 19.0924 |
| 4 | 06380031 | 0.474753 | 0.000634998 | 18.1468 | 06380030 | -0.00332394 | 0.478712 | 17.2526 |
| 5 | 06380028 | 0.472775 | 0.00261298 | 16.4482 | 06380029 | -0.00229510 | 0.477683 | 16.9773 |