| Red | Green | Blue | |
| z | 17.64 | ||
| znorm | Inf | ||
| sky | -Inf | -Inf | -Inf |
| S/N | 14.1 | 25.7 | 28.1 |
| S/N(c) | 0.0 | 0.0 | 0.0 |
| SN(E/C) |


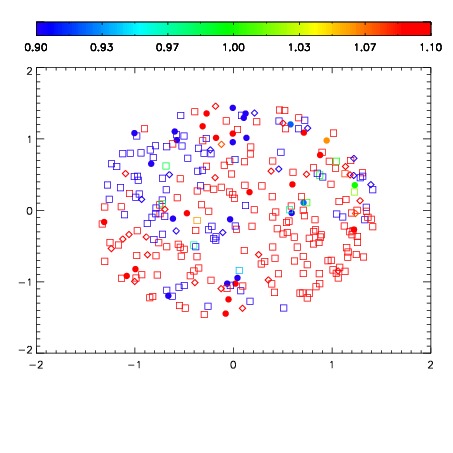
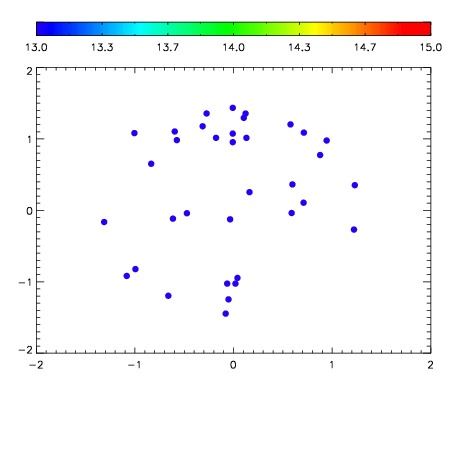

| Frame | Nreads | Zeropoints | Mag plots | Spatial mag deviation | Spatial sky 16325A emission deviations (filled: sky, open: star) | Spatial sky continuum emission | Spatial sky telluric CO2 absorption deviations (filled: H < 10) | |||||||||||||||||||||||
| 0 | 0 |
|
|
|
|
|
|
| IPAIR | NAME | SHIFT | NEWSHIFT | S/N | NAME | SHIFT | NEWSHIFT | S/N |
| 0 | 06620034 | 0.481314 | 0.00000 | 18.4399 | 06620035 | 0.00145681 | 0.479857 | 18.2083 |
| 1 | 06620033 | 0.480579 | 0.000735015 | 18.6767 | 06620032 | 0.00000 | 0.481314 | 18.6097 |
| 2 | 06620037 | 0.476862 | 0.00445199 | 18.0125 | 06620039 | 0.000402981 | 0.480911 | 18.1049 |
| 3 | 06620038 | 0.477667 | 0.00364700 | 16.9687 | 06620036 | 0.00525078 | 0.476063 | 16.2424 |