| Red | Green | Blue | |
| z | 17.64 | ||
| znorm | Inf | ||
| sky | -Inf | -Inf | -Inf |
| S/N | 28.6 | 44.5 | 50.9 |
| S/N(c) | 0.0 | 0.0 | 0.0 |
| SN(E/C) |
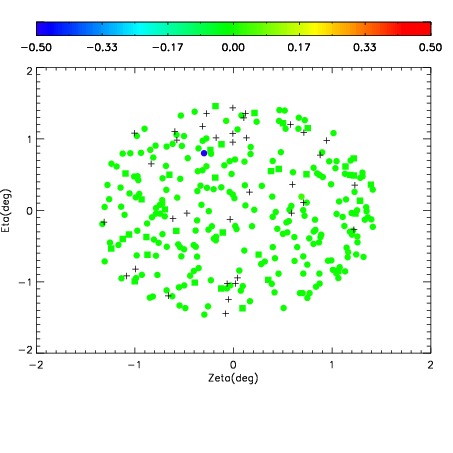
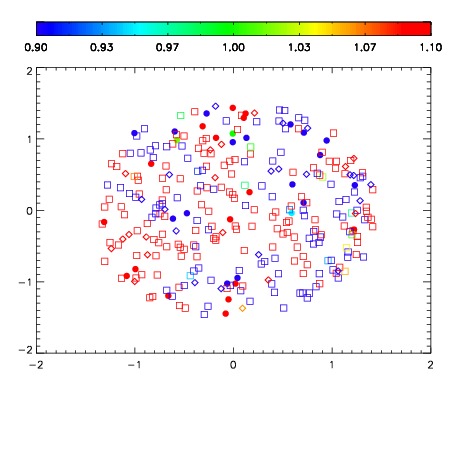


| Frame | Nreads | Zeropoints | Mag plots | Spatial mag deviation | Spatial sky 16325A emission deviations (filled: sky, open: star) | Spatial sky continuum emission | Spatial sky telluric CO2 absorption deviations (filled: H < 10) | |||||||||||||||||||||||
| 0 | 0 |
|
|
|
|
|
|
| IPAIR | NAME | SHIFT | NEWSHIFT | S/N | NAME | SHIFT | NEWSHIFT | S/N |
| 0 | 06950012 | 0.492220 | 0.00000 | 19.1023 | 06950017 | 0.00547963 | 0.486740 | 19.1083 |
| 1 | 06950015 | 0.491225 | 0.000995010 | 19.1494 | 06950014 | 0.00268996 | 0.489530 | 19.1365 |
| 2 | 06950016 | 0.491891 | 0.000329018 | 19.1409 | 06950013 | 0.00335607 | 0.488864 | 19.1124 |
| 3 | 06950011 | 0.491532 | 0.000688016 | 19.0520 | 06950010 | 0.00000 | 0.492220 | 19.0201 |