| Red | Green | Blue | |
| z | 17.64 | ||
| znorm | Inf | ||
| sky | -Inf | -NaN | -Inf |
| S/N | 21.7 | 39.5 | 42.1 |
| S/N(c) | 0.0 | 0.0 | 0.0 |
| SN(E/C) |
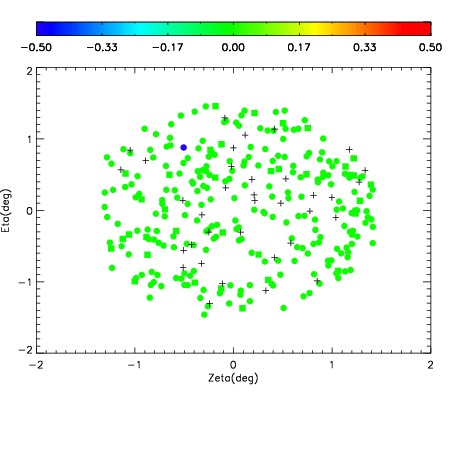
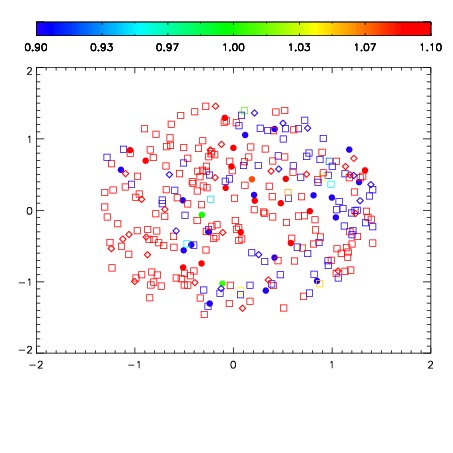
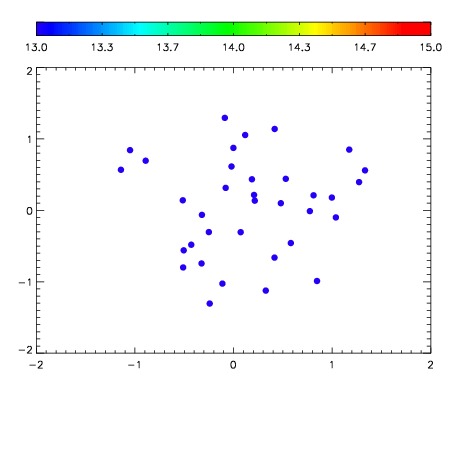

| Frame | Nreads | Zeropoints | Mag plots | Spatial mag deviation | Spatial sky 16325A emission deviations (filled: sky, open: star) | Spatial sky continuum emission | Spatial sky telluric CO2 absorption deviations (filled: H < 10) | |||||||||||||||||||||||
| 0 | 0 |
|
|
|
|
|
|
| IPAIR | NAME | SHIFT | NEWSHIFT | S/N | NAME | SHIFT | NEWSHIFT | S/N |
| 0 | 06720012 | 0.482687 | 0.00000 | 18.8790 | 06720014 | 0.00111640 | 0.481571 | 18.7334 |
| 1 | 06720015 | 0.479528 | 0.00315899 | 18.9418 | 06720013 | 0.00134083 | 0.481346 | 18.9146 |
| 2 | 06720016 | 0.481382 | 0.00130498 | 18.8248 | 06720010 | 0.00000 | 0.482687 | 18.6328 |
| 3 | 06720011 | 0.480240 | 0.00244701 | 18.5798 | 06720017 | 0.00157405 | 0.481113 | 18.5593 |