| Red | Green | Blue | |
| z | 17.64 | ||
| znorm | Inf | ||
| sky | -NaN | -NaN | -Inf |
| S/N | 20.8 | 36.6 | 37.5 |
| S/N(c) | 0.0 | 0.0 | 0.0 |
| SN(E/C) |

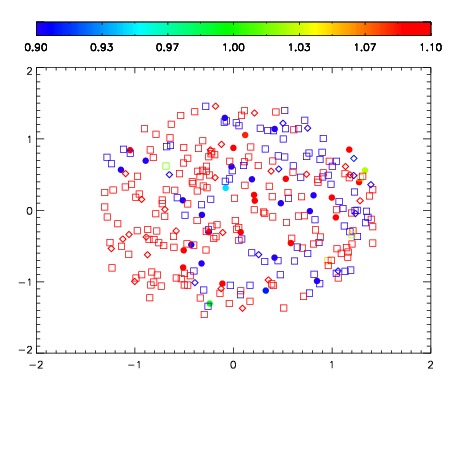
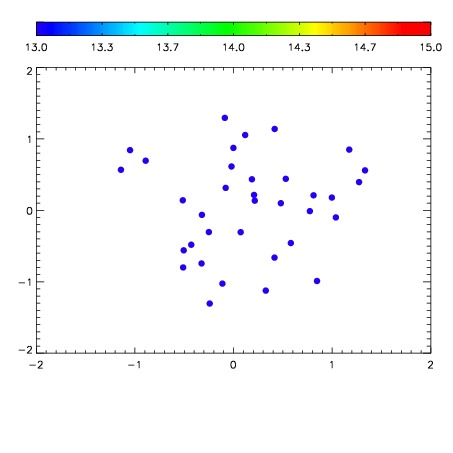

| Frame | Nreads | Zeropoints | Mag plots | Spatial mag deviation | Spatial sky 16325A emission deviations (filled: sky, open: star) | Spatial sky continuum emission | Spatial sky telluric CO2 absorption deviations (filled: H < 10) | |||||||||||||||||||||||
| 0 | 0 |
|
|
|
|
|
|
| IPAIR | NAME | SHIFT | NEWSHIFT | S/N | NAME | SHIFT | NEWSHIFT | S/N |
| 0 | 06960016 | 0.496502 | 0.00000 | 18.7285 | 06960015 | -0.00282569 | 0.499328 | 18.7638 |
| 1 | 06960012 | 0.495056 | 0.00144601 | 18.8619 | 06960011 | 0.00000 | 0.496502 | 18.8503 |
| 2 | 06960013 | 0.494358 | 0.00214401 | 18.8116 | 06960014 | -0.00281263 | 0.499315 | 18.8383 |
| 3 | 06960017 | 0.496184 | 0.000318021 | 18.5260 | 06960018 | 0.000827031 | 0.495675 | 18.0160 |