| Red | Green | Blue | |
| z | 17.64 | ||
| znorm | Inf | ||
| sky | -Inf | -Inf | -Inf |
| S/N | 26.6 | 50.1 | 55.0 |
| S/N(c) | 0.0 | 0.0 | 0.0 |
| SN(E/C) |


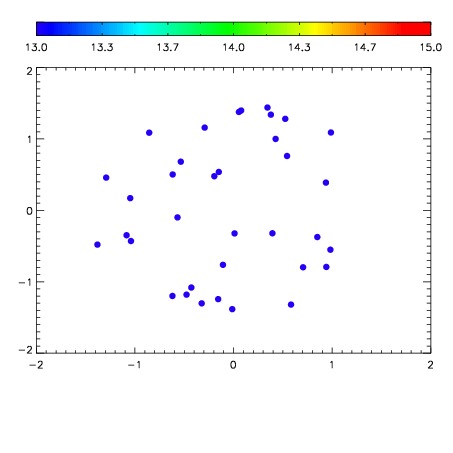

| Frame | Nreads | Zeropoints | Mag plots | Spatial mag deviation | Spatial sky 16325A emission deviations (filled: sky, open: star) | Spatial sky continuum emission | Spatial sky telluric CO2 absorption deviations (filled: H < 10) | |||||||||||||||||||||||
| 0 | 0 |
|
|
|
|
|
|
| IPAIR | NAME | SHIFT | NEWSHIFT | S/N | NAME | SHIFT | NEWSHIFT | S/N |
| 0 | 06630032 | 0.477802 | 0.00000 | 18.8651 | 06630038 | -0.00198704 | 0.479789 | 18.9149 |
| 1 | 06630036 | 0.475123 | 0.00267902 | 18.9201 | 06630041 | -0.00312121 | 0.480923 | 18.9519 |
| 2 | 06630040 | 0.475104 | 0.00269800 | 18.9097 | 06630037 | -0.000239887 | 0.478042 | 18.9341 |
| 3 | 06630031 | 0.477167 | 0.000634998 | 18.8572 | 06630034 | 6.32500e-05 | 0.477739 | 18.8842 |
| 4 | 06630039 | 0.474988 | 0.00281399 | 18.8289 | 06630033 | -0.000543326 | 0.478345 | 18.8714 |
| 5 | 06630035 | 0.475820 | 0.00198200 | 18.7651 | 06630030 | 0.00000 | 0.477802 | 18.8107 |