| Red | Green | Blue | |
| z | 17.64 | ||
| znorm | Inf | ||
| sky | -Inf | -Inf | -Inf |
| S/N | 30.8 | 48.9 | 54.8 |
| S/N(c) | 0.0 | 0.0 | 0.0 |
| SN(E/C) |
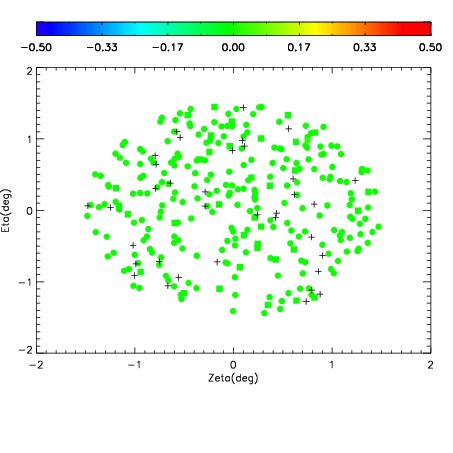
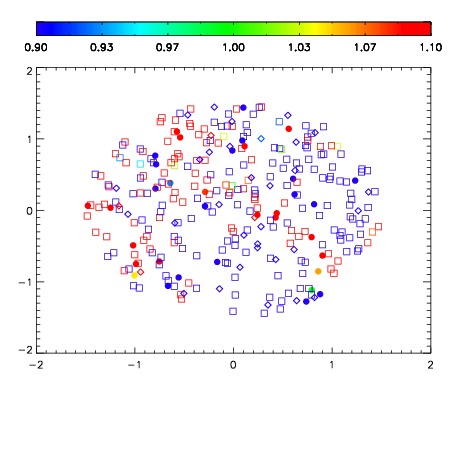
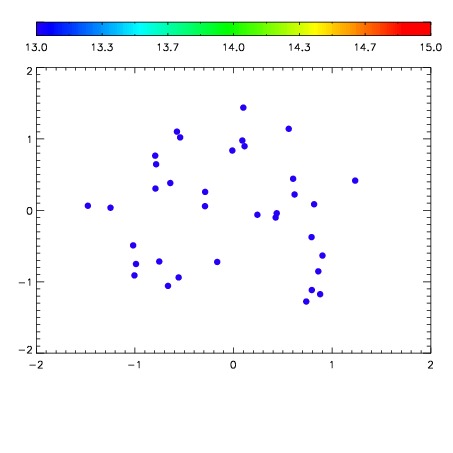

| Frame | Nreads | Zeropoints | Mag plots | Spatial mag deviation | Spatial sky 16325A emission deviations (filled: sky, open: star) | Spatial sky continuum emission | Spatial sky telluric CO2 absorption deviations (filled: H < 10) | |||||||||||||||||||||||
| 0 | 0 |
|
|
|
|
|
|
| IPAIR | NAME | SHIFT | NEWSHIFT | S/N | NAME | SHIFT | NEWSHIFT | S/N |
| 0 | 06680049 | 0.484628 | 0.00000 | 18.8471 | 06680050 | 0.00288834 | 0.481740 | 18.9047 |
| 1 | 06680045 | 0.484235 | 0.000393003 | 19.1475 | 06680046 | -0.000973483 | 0.485601 | 19.1981 |
| 2 | 06680044 | 0.483943 | 0.000685006 | 19.1240 | 06680047 | -0.00127654 | 0.485905 | 19.1652 |
| 3 | 06680048 | 0.483994 | 0.000633985 | 19.1215 | 06680043 | 0.00000 | 0.484628 | 19.1544 |