| Red | Green | Blue | |
| z | 17.64 | ||
| znorm | Inf | ||
| sky | -Inf | -NaN | -Inf |
| S/N | 33.1 | 54.3 | 62.0 |
| S/N(c) | 0.0 | 0.0 | 0.0 |
| SN(E/C) |
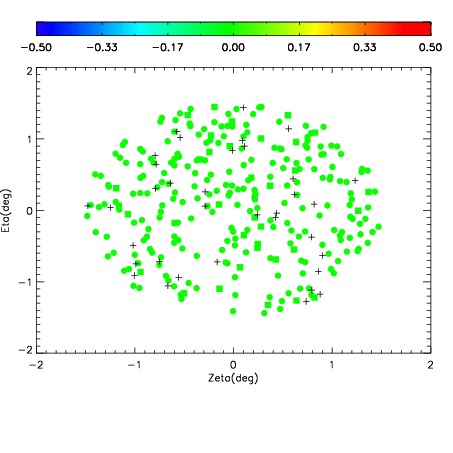
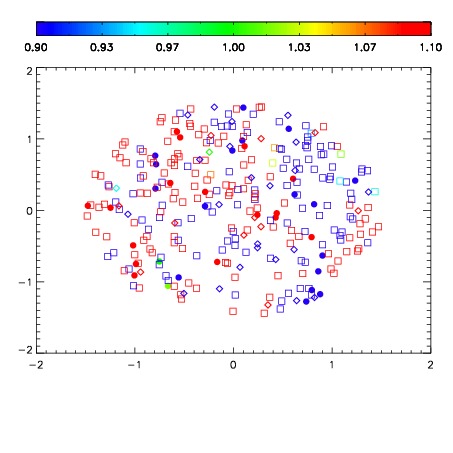
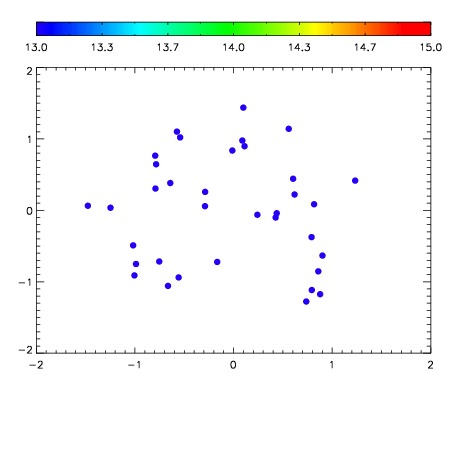

| Frame | Nreads | Zeropoints | Mag plots | Spatial mag deviation | Spatial sky 16325A emission deviations (filled: sky, open: star) | Spatial sky continuum emission | Spatial sky telluric CO2 absorption deviations (filled: H < 10) | |||||||||||||||||||||||
| 0 | 0 |
|
|
|
|
|
|
| IPAIR | NAME | SHIFT | NEWSHIFT | S/N | NAME | SHIFT | NEWSHIFT | S/N |
| 0 | 06920047 | 0.500098 | 0.00000 | 19.1267 | 06920041 | 0.00151708 | 0.498581 | 19.1353 |
| 1 | 06920046 | 0.499504 | 0.000593990 | 19.1421 | 06920040 | 0.00398071 | 0.496117 | 19.1401 |
| 2 | 06920042 | 0.497863 | 0.00223500 | 19.1098 | 06920045 | -0.000341226 | 0.500439 | 19.1171 |
| 3 | 06920043 | 0.497951 | 0.00214699 | 19.1080 | 06920044 | 0.00347969 | 0.496618 | 19.0991 |
| 4 | 06920039 | 0.498873 | 0.00122499 | 19.0983 | 06920048 | 0.00376157 | 0.496336 | 19.0856 |
| 5 | 06920038 | 0.498330 | 0.00176799 | 19.0969 | 06920037 | 0.00000 | 0.500098 | 19.0538 |