| Red | Green | Blue | |
| z | 17.64 | ||
| znorm | Inf | ||
| sky | -NaN | -NaN | -Inf |
| S/N | 24.4 | 41.8 | 43.2 |
| S/N(c) | 0.0 | 0.0 | 0.0 |
| SN(E/C) |
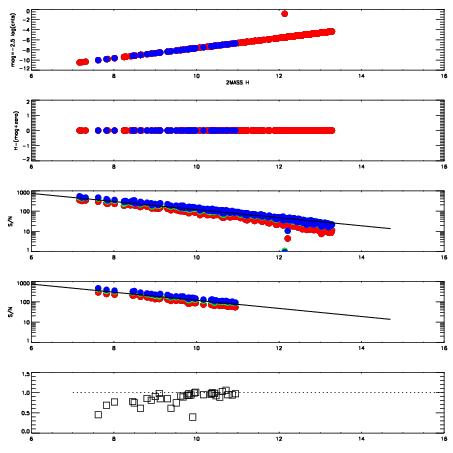
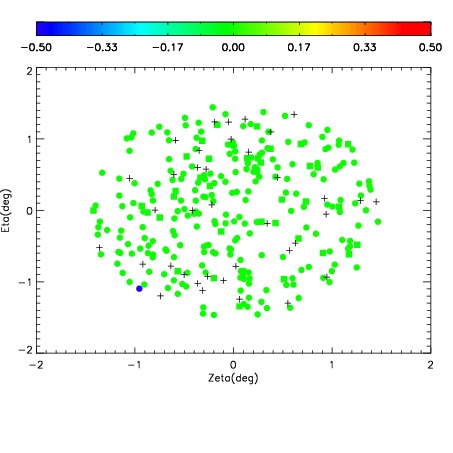
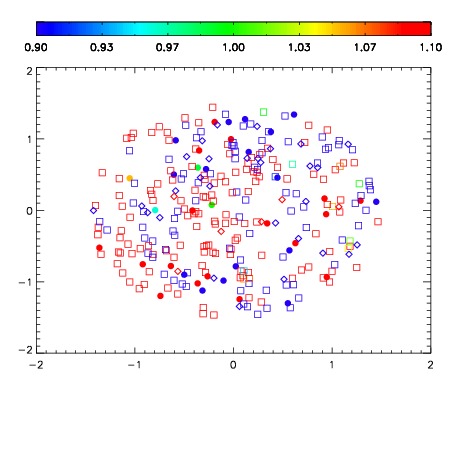


| Frame | Nreads | Zeropoints | Mag plots | Spatial mag deviation | Spatial sky 16325A emission deviations (filled: sky, open: star) | Spatial sky continuum emission | Spatial sky telluric CO2 absorption deviations (filled: H < 10) | |||||||||||||||||||||||
| 0 | 0 |
|
|
|
|
|
|
| IPAIR | NAME | SHIFT | NEWSHIFT | S/N | NAME | SHIFT | NEWSHIFT | S/N |
| 0 | 06090075 | 0.480875 | 0.00000 | 18.7784 | 06090076 | -0.00248005 | 0.483355 | 18.8259 |
| 1 | 06090079 | 0.478132 | 0.00274298 | 19.0327 | 06090080 | -0.00277511 | 0.483650 | 18.9250 |
| 2 | 06090078 | 0.477528 | 0.00334698 | 19.0183 | 06090077 | -0.00405804 | 0.484933 | 18.8690 |
| 3 | 06090074 | 0.480736 | 0.000138998 | 18.6314 | 06090073 | 0.00000 | 0.480875 | 18.6641 |