| Red | Green | Blue | |
| z | 17.64 | ||
| znorm | Inf | ||
| sky | -NaN | -Inf | -NaN |
| S/N | 29.8 | 49.4 | 52.1 |
| S/N(c) | 0.0 | 0.0 | 0.0 |
| SN(E/C) |

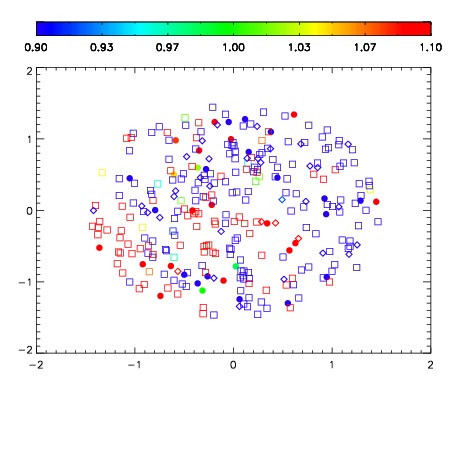


| Frame | Nreads | Zeropoints | Mag plots | Spatial mag deviation | Spatial sky 16325A emission deviations (filled: sky, open: star) | Spatial sky continuum emission | Spatial sky telluric CO2 absorption deviations (filled: H < 10) | |||||||||||||||||||||||
| 0 | 0 |
|
|
|
|
|
|
| IPAIR | NAME | SHIFT | NEWSHIFT | S/N | NAME | SHIFT | NEWSHIFT | S/N |
| 0 | 06150044 | 0.485762 | 0.00000 | 19.2145 | 06150045 | -0.000298165 | 0.486060 | 19.2242 |
| 1 | 06150047 | 0.481218 | 0.00454399 | 19.2549 | 06150049 | -0.000334077 | 0.486096 | 19.2568 |
| 2 | 06150048 | 0.482924 | 0.00283799 | 19.2466 | 06150046 | -0.00215903 | 0.487921 | 19.2388 |
| 3 | 06150043 | 0.479464 | 0.00629801 | 19.2260 | 06150042 | 0.00000 | 0.485762 | 19.2319 |