| Red | Green | Blue | |
| z | 17.64 | ||
| znorm | Inf | ||
| sky | -NaN | -Inf | -Inf |
| S/N | 26.2 | 45.4 | 48.1 |
| S/N(c) | 0.0 | 0.0 | 0.0 |
| SN(E/C) |


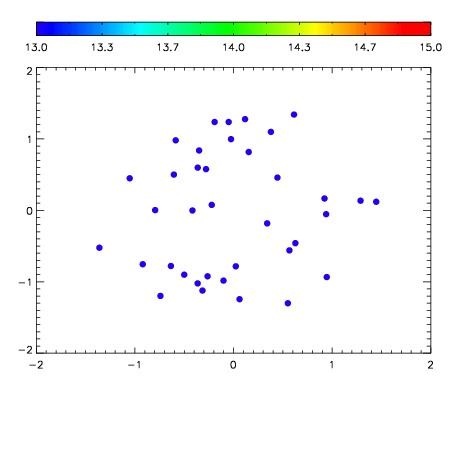

| Frame | Nreads | Zeropoints | Mag plots | Spatial mag deviation | Spatial sky 16325A emission deviations (filled: sky, open: star) | Spatial sky continuum emission | Spatial sky telluric CO2 absorption deviations (filled: H < 10) | |||||||||||||||||||||||
| 0 | 0 |
|
|
|
|
|
|
| IPAIR | NAME | SHIFT | NEWSHIFT | S/N | NAME | SHIFT | NEWSHIFT | S/N |
| 0 | 06670061 | 0.475428 | 0.00000 | 19.0582 | 06670066 | 0.00217587 | 0.473252 | 19.0694 |
| 1 | 06670060 | 0.475195 | 0.000232995 | 19.0783 | 06670059 | 0.00000 | 0.475428 | 19.0932 |
| 2 | 06670065 | 0.475014 | 0.000413984 | 19.0499 | 06670063 | 0.00129058 | 0.474137 | 19.0681 |
| 3 | 06670064 | 0.474179 | 0.00124899 | 19.0370 | 06670062 | 0.000316415 | 0.475112 | 19.0455 |