| Red | Green | Blue | |
| z | 17.64 | ||
| znorm | Inf | ||
| sky | -Inf | -Inf | -Inf |
| S/N | 24.7 | 43.4 | 45.0 |
| S/N(c) | 0.0 | 0.0 | 0.0 |
| SN(E/C) |

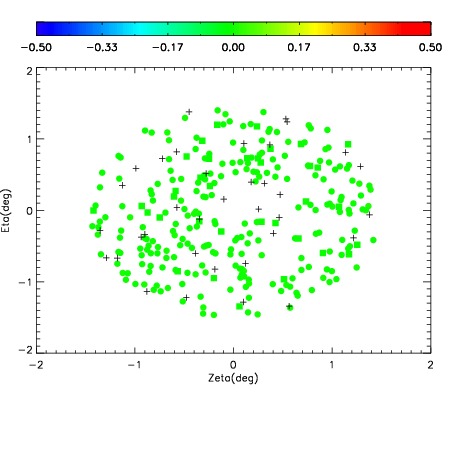
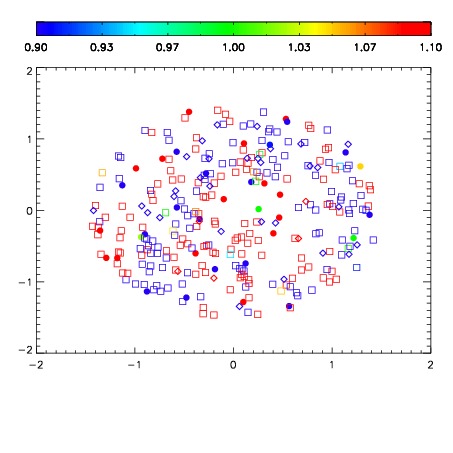


| Frame | Nreads | Zeropoints | Mag plots | Spatial mag deviation | Spatial sky 16325A emission deviations (filled: sky, open: star) | Spatial sky continuum emission | Spatial sky telluric CO2 absorption deviations (filled: H < 10) | |||||||||||||||||||||||
| 0 | 0 |
|
|
|
|
|
|
| IPAIR | NAME | SHIFT | NEWSHIFT | S/N | NAME | SHIFT | NEWSHIFT | S/N |
| 0 | 06100076 | 0.488484 | 0.00000 | 18.9868 | 06100078 | -0.00164247 | 0.490126 | 18.9924 |
| 1 | 06100080 | 0.487533 | 0.000950992 | 19.0492 | 06100081 | 0.00607014 | 0.482414 | 19.0746 |
| 2 | 06100075 | 0.487963 | 0.000521004 | 18.9316 | 06100077 | 0.000293431 | 0.488191 | 18.7934 |
| 3 | 06100079 | 0.487825 | 0.000658989 | 18.8161 | 06100074 | 0.00000 | 0.488484 | 18.7402 |