| Red | Green | Blue | |
| z | 17.64 | ||
| znorm | Inf | ||
| sky | -Inf | -Inf | -Inf |
| S/N | 25.9 | 44.8 | 48.0 |
| S/N(c) | 0.0 | 0.0 | 0.0 |
| SN(E/C) |
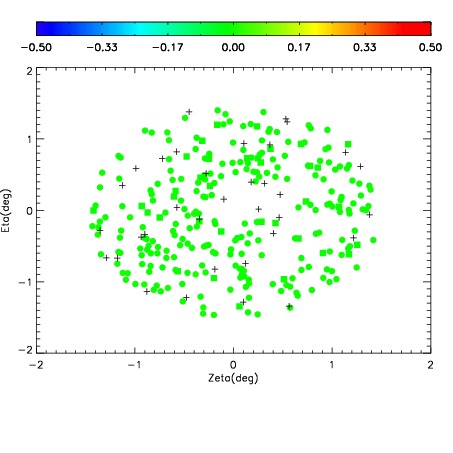
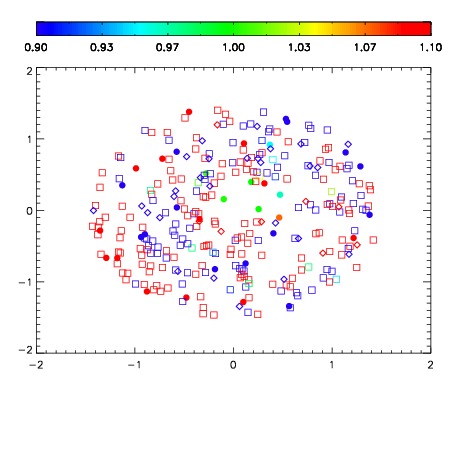
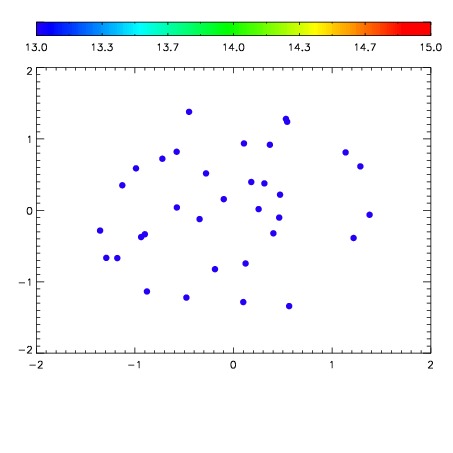

| Frame | Nreads | Zeropoints | Mag plots | Spatial mag deviation | Spatial sky 16325A emission deviations (filled: sky, open: star) | Spatial sky continuum emission | Spatial sky telluric CO2 absorption deviations (filled: H < 10) | |||||||||||||||||||||||
| 0 | 0 |
|
|
|
|
|
|
| IPAIR | NAME | SHIFT | NEWSHIFT | S/N | NAME | SHIFT | NEWSHIFT | S/N |
| 0 | 06680060 | 0.482732 | 0.00000 | 18.9422 | 06680054 | 0.00000 | 0.482732 | 18.7981 |
| 1 | 06680056 | 0.482212 | 0.000519991 | 19.0471 | 06680058 | -0.00329039 | 0.486022 | 18.9896 |
| 2 | 06680059 | 0.482456 | 0.000275999 | 19.0397 | 06680057 | -0.00186873 | 0.484601 | 18.9388 |
| 3 | 06680055 | 0.481712 | 0.00101998 | 18.9826 | 06680061 | -0.00185123 | 0.484583 | 18.8791 |