| Red | Green | Blue | |
| z | 17.64 | ||
| znorm | Inf | ||
| sky | -Inf | -Inf | -Inf |
| S/N | 24.9 | 42.5 | 45.5 |
| S/N(c) | 0.0 | 0.0 | 0.0 |
| SN(E/C) |
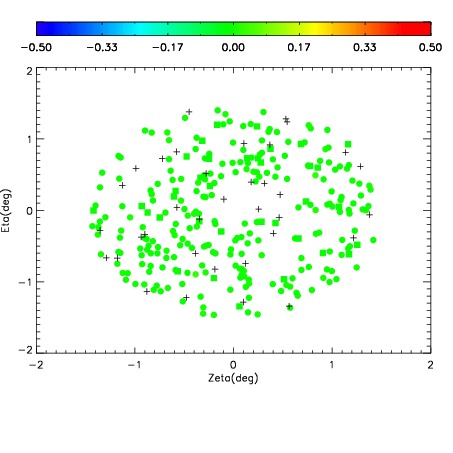


| Frame | Nreads | Zeropoints | Mag plots | Spatial mag deviation | Spatial sky 16325A emission deviations (filled: sky, open: star) | Spatial sky continuum emission | Spatial sky telluric CO2 absorption deviations (filled: H < 10) | |||||||||||||||||||||||
| 0 | 0 |
|
|
|
|
|
|
| IPAIR | NAME | SHIFT | NEWSHIFT | S/N | NAME | SHIFT | NEWSHIFT | S/N |
| 0 | 06720038 | 0.480937 | 0.00000 | 19.1075 | 06720035 | -0.00571790 | 0.486655 | 18.9873 |
| 1 | 06720037 | 0.478343 | 0.00259399 | 19.1431 | 06720039 | -0.00243544 | 0.483372 | 19.1245 |
| 2 | 06720034 | 0.480190 | 0.000746995 | 19.0067 | 06720032 | 0.00000 | 0.480937 | 18.7323 |
| 3 | 06720033 | 0.478771 | 0.00216600 | 18.9605 | 06720036 | -0.00458697 | 0.485524 | 17.9928 |