| Red | Green | Blue | |
| z | 17.64 | ||
| znorm | Inf | ||
| sky | -Inf | -Inf | -Inf |
| S/N | 14.2 | 25.7 | 27.7 |
| S/N(c) | 0.0 | 0.0 | 0.0 |
| SN(E/C) |


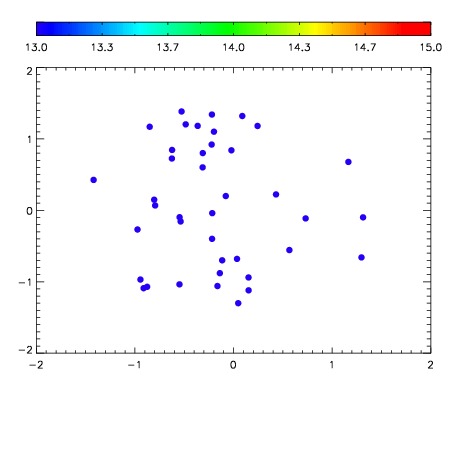

| Frame | Nreads | Zeropoints | Mag plots | Spatial mag deviation | Spatial sky 16325A emission deviations (filled: sky, open: star) | Spatial sky continuum emission | Spatial sky telluric CO2 absorption deviations (filled: H < 10) | |||||||||||||||||||||||
| 0 | 0 |
|
|
|
|
|
|
| IPAIR | NAME | SHIFT | NEWSHIFT | S/N | NAME | SHIFT | NEWSHIFT | S/N |
| 0 | 06110089 | 0.485741 | 0.00000 | 15.3131 | 06110087 | -0.000186410 | 0.485927 | 17.2635 |
| 1 | 06110090 | 0.483304 | 0.00243700 | 18.8280 | 06110083 | -0.000759348 | 0.486500 | 18.2709 |
| 2 | 06110086 | 0.484156 | 0.00158498 | 18.5101 | 06110088 | -0.00197726 | 0.487718 | 18.1526 |
| 3 | 06110082 | 0.484437 | 0.00130400 | 17.0897 | 06110091 | -0.00118668 | 0.486928 | 18.0496 |
| 4 | 06110085 | 0.484134 | 0.00160700 | 16.9676 | 06110084 | -8.69000e-05 | 0.485828 | 17.5012 |
| 5 | 06110081 | 0.484248 | 0.00149298 | 16.7906 | 06110080 | 0.00000 | 0.485741 | 17.4035 |