| Red | Green | Blue | |
| z | 17.64 | ||
| znorm | Inf | ||
| sky | -Inf | -NaN | -Inf |
| S/N | 30.3 | 50.5 | 49.5 |
| S/N(c) | 0.0 | 0.0 | 0.0 |
| SN(E/C) |
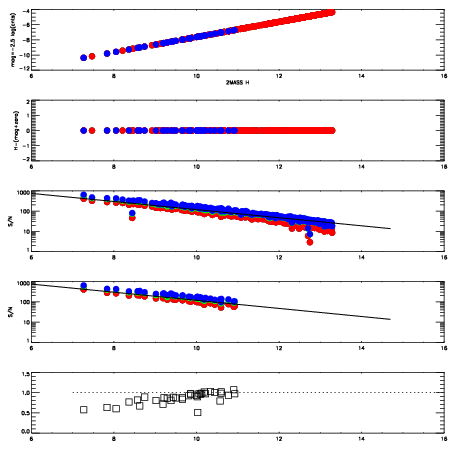
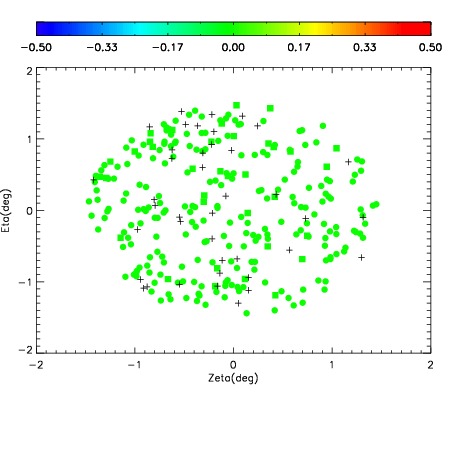
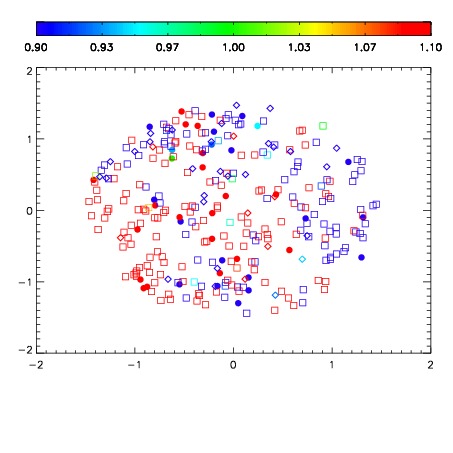


| Frame | Nreads | Zeropoints | Mag plots | Spatial mag deviation | Spatial sky 16325A emission deviations (filled: sky, open: star) | Spatial sky continuum emission | Spatial sky telluric CO2 absorption deviations (filled: H < 10) | |||||||||||||||||||||||
| 0 | 0 |
|
|
|
|
|
|
| IPAIR | NAME | SHIFT | NEWSHIFT | S/N | NAME | SHIFT | NEWSHIFT | S/N |
| 0 | 06410070 | 0.479274 | 0.00000 | 19.1055 | 06410072 | 0.00367427 | 0.475600 | 19.0749 |
| 1 | 06410069 | 0.479216 | 5.79953e-05 | 19.1421 | 06410075 | 0.00618837 | 0.473086 | 19.1489 |
| 2 | 06410074 | 0.478406 | 0.000867993 | 19.1189 | 06410068 | 0.00000 | 0.479274 | 19.1357 |
| 3 | 06410073 | 0.477934 | 0.00134000 | 19.0885 | 06410071 | 0.00275994 | 0.476514 | 19.0671 |