| Red | Green | Blue | |
| z | 17.64 | ||
| znorm | Inf | ||
| sky | -NaN | -Inf | -Inf |
| S/N | 26.9 | 46.6 | 48.1 |
| S/N(c) | 0.0 | 0.0 | 0.0 |
| SN(E/C) |
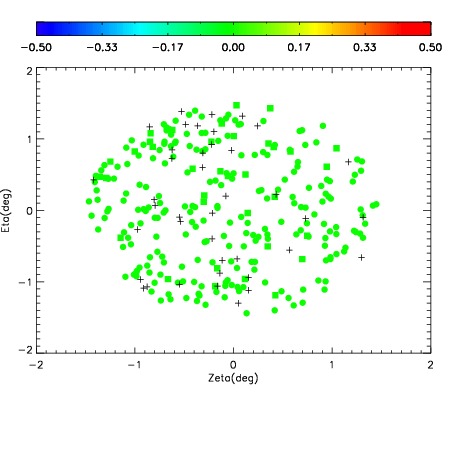


| Frame | Nreads | Zeropoints | Mag plots | Spatial mag deviation | Spatial sky 16325A emission deviations (filled: sky, open: star) | Spatial sky continuum emission | Spatial sky telluric CO2 absorption deviations (filled: H < 10) | |||||||||||||||||||||||
| 0 | 0 |
|
|
|
|
|
|
| IPAIR | NAME | SHIFT | NEWSHIFT | S/N | NAME | SHIFT | NEWSHIFT | S/N |
| 0 | 06650065 | 0.483280 | 0.00000 | 19.0858 | 06650063 | 0.00284380 | 0.480436 | 19.0720 |
| 1 | 06650060 | 0.479731 | 0.00354901 | 19.1131 | 06650062 | 0.00170657 | 0.481573 | 19.1326 |
| 2 | 06650061 | 0.480433 | 0.00284702 | 19.0924 | 06650059 | 0.00000 | 0.483280 | 19.0982 |
| 3 | 06650064 | 0.482680 | 0.000600010 | 18.9456 | 06650066 | 0.00318894 | 0.480091 | 19.0209 |