| Red | Green | Blue | |
| z | 17.64 | ||
| znorm | Inf | ||
| sky | -Inf | -Inf | -Inf |
| S/N | 28.2 | 48.2 | 51.7 |
| S/N(c) | 0.0 | 0.0 | 0.0 |
| SN(E/C) |
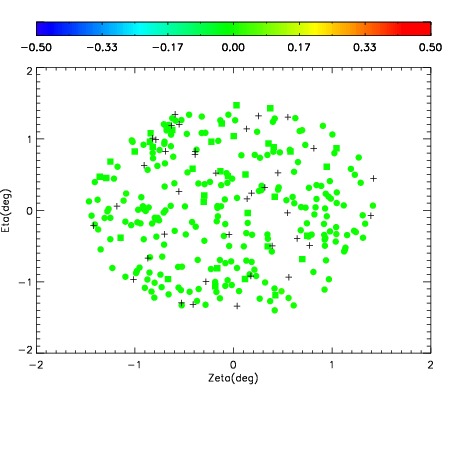
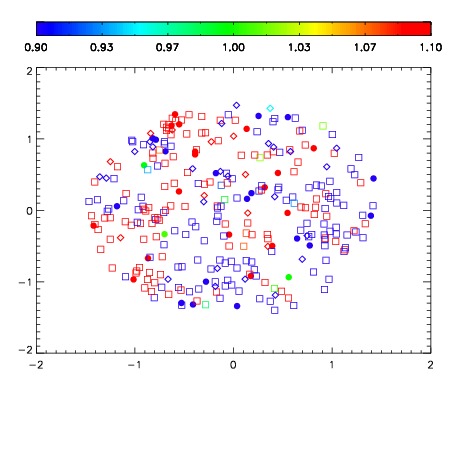
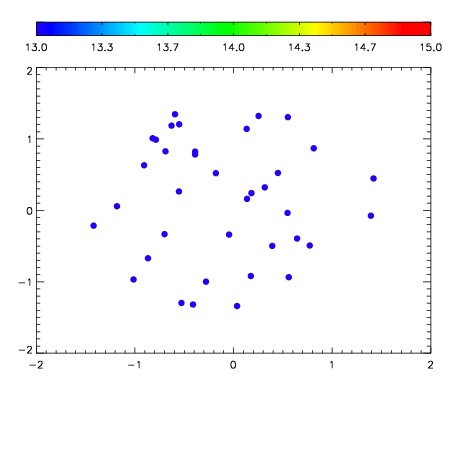

| Frame | Nreads | Zeropoints | Mag plots | Spatial mag deviation | Spatial sky 16325A emission deviations (filled: sky, open: star) | Spatial sky continuum emission | Spatial sky telluric CO2 absorption deviations (filled: H < 10) | |||||||||||||||||||||||
| 0 | 0 |
|
|
|
|
|
|
| IPAIR | NAME | SHIFT | NEWSHIFT | S/N | NAME | SHIFT | NEWSHIFT | S/N |
| 0 | 06660064 | 0.486578 | 0.00000 | 19.1075 | 06660061 | -0.00132089 | 0.487899 | 19.0780 |
| 1 | 06660060 | 0.486551 | 2.70009e-05 | 19.0693 | 06660065 | 0.000281351 | 0.486297 | 19.0752 |
| 2 | 06660059 | 0.486152 | 0.000425994 | 19.0532 | 06660058 | 0.00000 | 0.486578 | 19.0666 |
| 3 | 06660063 | 0.486413 | 0.000164986 | 19.0448 | 06660062 | 0.000301266 | 0.486277 | 19.0663 |