| Red | Green | Blue | |
| z | 17.64 | ||
| znorm | Inf | ||
| sky | -NaN | -NaN | -Inf |
| S/N | 30.5 | 51.3 | 54.5 |
| S/N(c) | 0.0 | 0.0 | 0.0 |
| SN(E/C) |
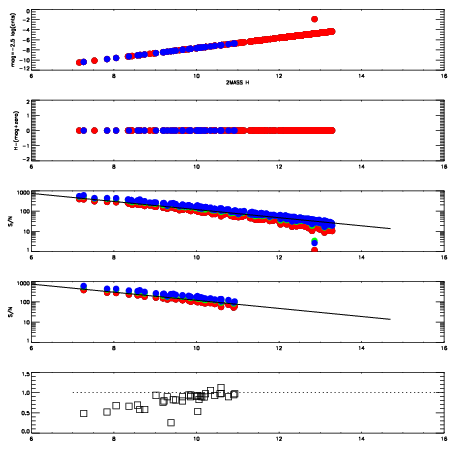
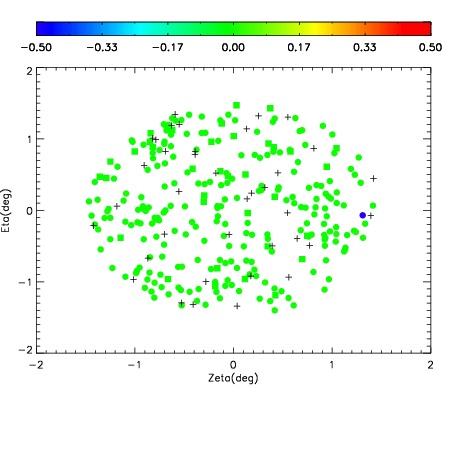
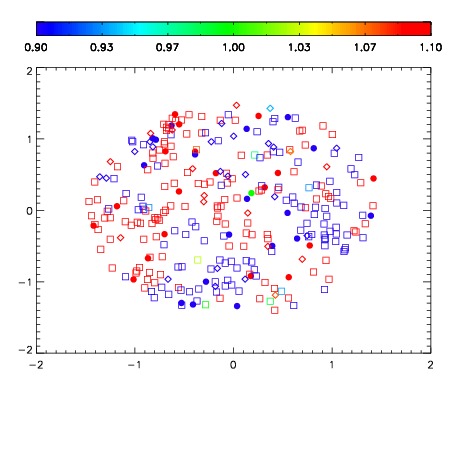
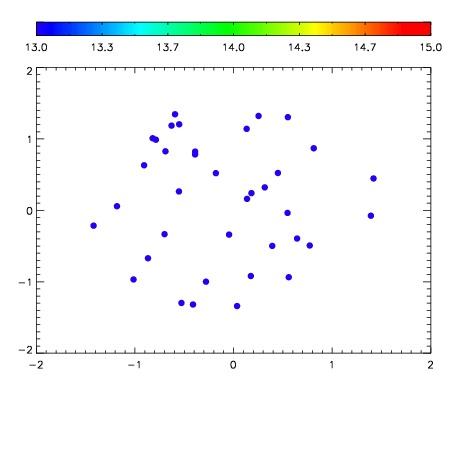

| Frame | Nreads | Zeropoints | Mag plots | Spatial mag deviation | Spatial sky 16325A emission deviations (filled: sky, open: star) | Spatial sky continuum emission | Spatial sky telluric CO2 absorption deviations (filled: H < 10) | |||||||||||||||||||||||
| 0 | 0 |
|
|
|
|
|
|
| IPAIR | NAME | SHIFT | NEWSHIFT | S/N | NAME | SHIFT | NEWSHIFT | S/N |
| 0 | 06700058 | 0.486310 | 0.00000 | 19.1818 | 06700059 | -0.000102110 | 0.486412 | 19.1842 |
| 1 | 06700053 | 0.478038 | 0.00827199 | 19.1770 | 06700056 | -0.00693306 | 0.493243 | 19.1706 |
| 2 | 06700057 | 0.483999 | 0.00231099 | 19.1636 | 06700055 | -0.00443936 | 0.490749 | 19.1634 |
| 3 | 06700054 | 0.479584 | 0.00672600 | 19.1578 | 06700052 | 0.00000 | 0.486310 | 19.1606 |