| Red | Green | Blue | |
| z | 17.64 | ||
| znorm | Inf | ||
| sky | -Inf | -NaN | -Inf |
| S/N | 28.4 | 50.3 | 52.3 |
| S/N(c) | 0.0 | 0.0 | 0.0 |
| SN(E/C) |
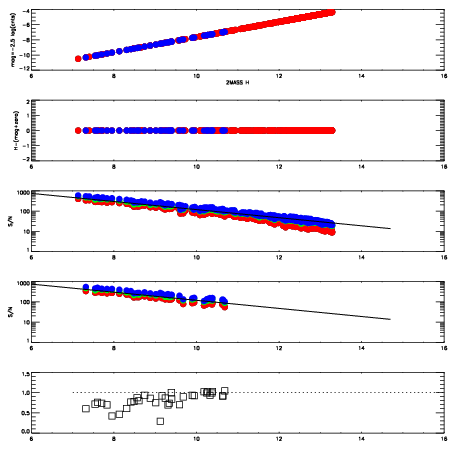
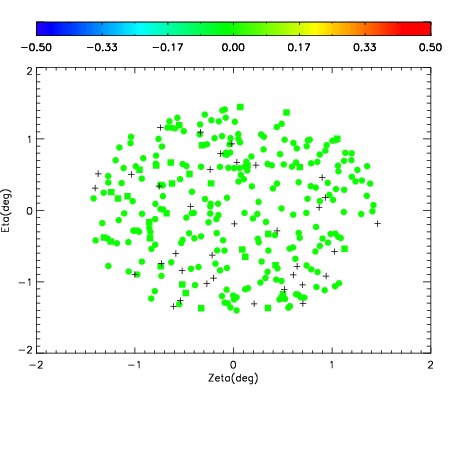
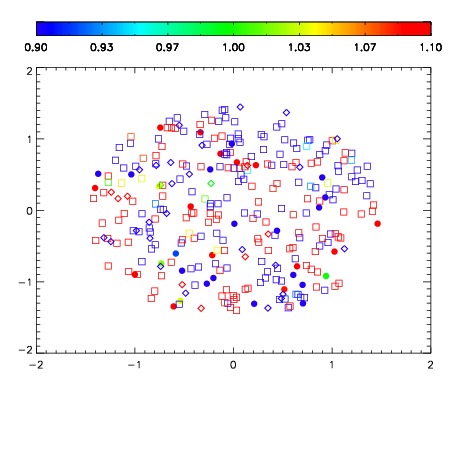
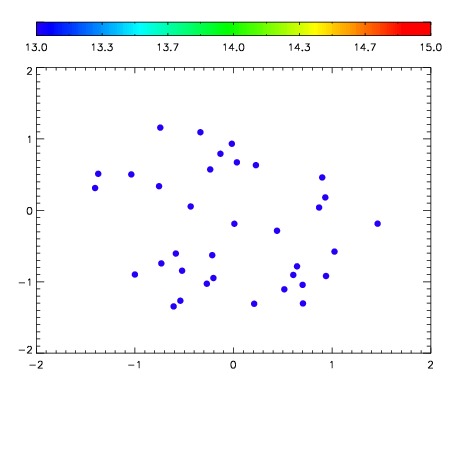

| Frame | Nreads | Zeropoints | Mag plots | Spatial mag deviation | Spatial sky 16325A emission deviations (filled: sky, open: star) | Spatial sky continuum emission | Spatial sky telluric CO2 absorption deviations (filled: H < 10) | |||||||||||||||||||||||
| 0 | 0 |
|
|
|
|
|
|
| IPAIR | NAME | SHIFT | NEWSHIFT | S/N | NAME | SHIFT | NEWSHIFT | S/N |
| 0 | 06070070 | 0.478191 | 0.00000 | 19.0541 | 06070073 | -0.00132087 | 0.479512 | 19.0359 |
| 1 | 06070075 | 0.477466 | 0.000725001 | 19.1248 | 06070076 | 3.59549e-05 | 0.478155 | 19.0890 |
| 2 | 06070071 | 0.477868 | 0.000322998 | 19.0767 | 06070072 | 0.000780568 | 0.477410 | 19.0817 |
| 3 | 06070074 | 0.476725 | 0.00146598 | 18.9863 | 06070069 | 0.00000 | 0.478191 | 18.9703 |