| Red | Green | Blue | |
| z | 17.64 | ||
| znorm | Inf | ||
| sky | -Inf | -Inf | -Inf |
| S/N | 29.4 | 48.8 | 51.5 |
| S/N(c) | 0.0 | 0.0 | 0.0 |
| SN(E/C) |
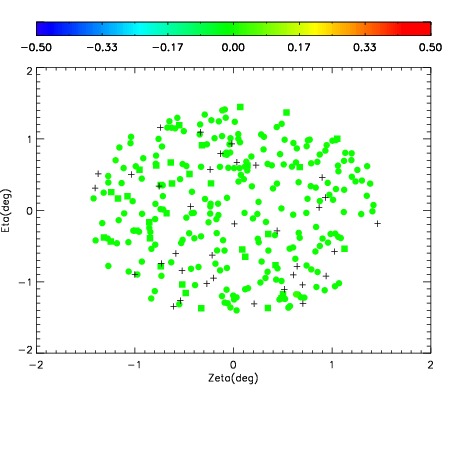


| Frame | Nreads | Zeropoints | Mag plots | Spatial mag deviation | Spatial sky 16325A emission deviations (filled: sky, open: star) | Spatial sky continuum emission | Spatial sky telluric CO2 absorption deviations (filled: H < 10) | |||||||||||||||||||||||
| 0 | 0 |
|
|
|
|
|
|
| IPAIR | NAME | SHIFT | NEWSHIFT | S/N | NAME | SHIFT | NEWSHIFT | S/N |
| 0 | 06410063 | 0.475532 | 0.00000 | 19.1602 | 06410064 | 0.000125713 | 0.475406 | 19.1729 |
| 1 | 06410062 | 0.475480 | 5.20051e-05 | 19.1434 | 06410061 | -0.000216723 | 0.475749 | 19.1265 |
| 2 | 06410059 | 0.474374 | 0.00115800 | 19.1189 | 06410060 | 0.00160419 | 0.473928 | 19.1243 |
| 3 | 06410058 | 0.474384 | 0.00114799 | 19.1187 | 06410057 | 0.00000 | 0.475532 | 19.1225 |