| Red | Green | Blue | |
| z | 17.64 | ||
| znorm | Inf | ||
| sky | -Inf | -NaN | -Inf |
| S/N | 28.5 | 46.1 | 51.1 |
| S/N(c) | 0.0 | 0.0 | 0.0 |
| SN(E/C) |
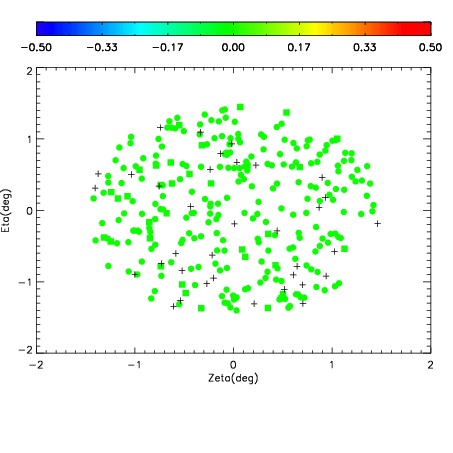
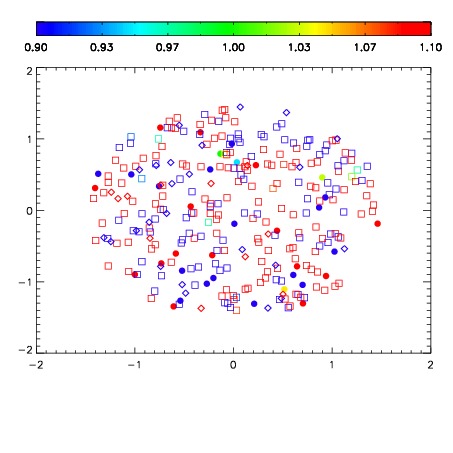
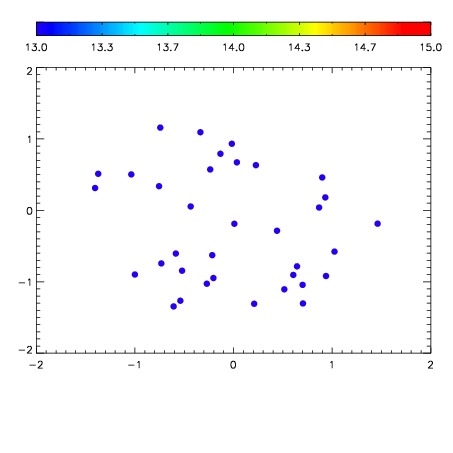

| Frame | Nreads | Zeropoints | Mag plots | Spatial mag deviation | Spatial sky 16325A emission deviations (filled: sky, open: star) | Spatial sky continuum emission | Spatial sky telluric CO2 absorption deviations (filled: H < 10) | |||||||||||||||||||||||
| 0 | 0 |
|
|
|
|
|
|
| IPAIR | NAME | SHIFT | NEWSHIFT | S/N | NAME | SHIFT | NEWSHIFT | S/N |
| 0 | 06430049 | 0.482791 | 0.00000 | 19.1195 | 06430051 | 0.00213688 | 0.480654 | 19.0390 |
| 1 | 06430048 | 0.482004 | 0.000787020 | 19.1415 | 06430054 | -0.00170373 | 0.484495 | 19.1215 |
| 2 | 06430053 | 0.481791 | 0.00100002 | 19.1249 | 06430047 | 0.00000 | 0.482791 | 19.1134 |
| 3 | 06430052 | 0.481794 | 0.000997007 | 19.0934 | 06430050 | 0.00162917 | 0.481162 | 19.0266 |