| Red | Green | Blue | |
| z | 17.64 | ||
| znorm | Inf | ||
| sky | -Inf | -Inf | -Inf |
| S/N | 23.3 | 42.4 | 44.0 |
| S/N(c) | 0.0 | 0.0 | 0.0 |
| SN(E/C) |
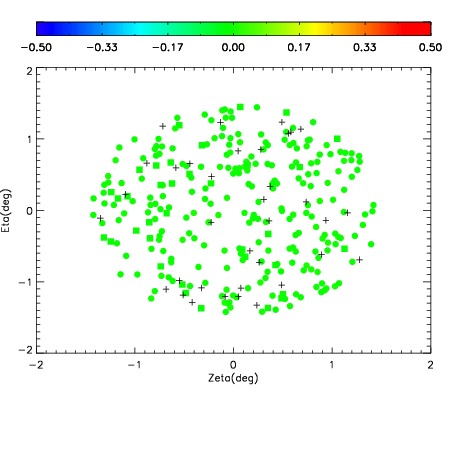
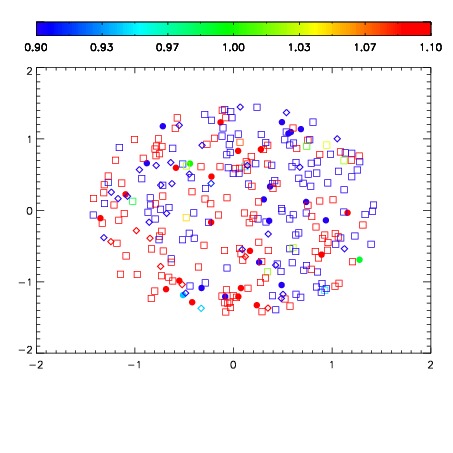
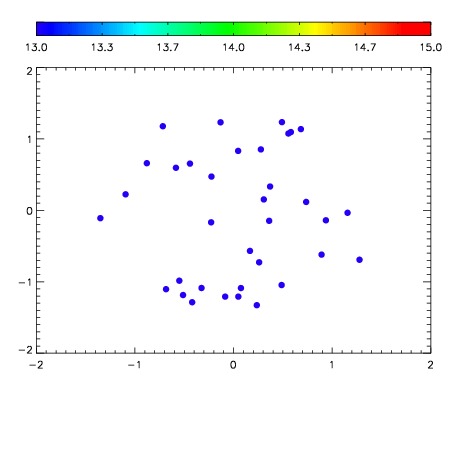

| Frame | Nreads | Zeropoints | Mag plots | Spatial mag deviation | Spatial sky 16325A emission deviations (filled: sky, open: star) | Spatial sky continuum emission | Spatial sky telluric CO2 absorption deviations (filled: H < 10) | |||||||||||||||||||||||
| 0 | 0 |
|
|
|
|
|
|
| IPAIR | NAME | SHIFT | NEWSHIFT | S/N | NAME | SHIFT | NEWSHIFT | S/N |
| 0 | 06080081 | 0.487603 | 0.00000 | 18.8774 | 06080083 | 0.00175111 | 0.485852 | 18.8520 |
| 1 | 06080082 | 0.487241 | 0.000362009 | 18.8796 | 06080084 | -4.70999e-05 | 0.487650 | 18.9444 |
| 2 | 06080085 | 0.482711 | 0.00489202 | 18.8770 | 06080080 | 0.00000 | 0.487603 | 18.8483 |
| 3 | 06080086 | 0.482285 | 0.00531802 | 18.4875 | 06080087 | 0.00194286 | 0.485660 | 18.7780 |