| Red | Green | Blue | |
| z | 17.64 | ||
| znorm | Inf | ||
| sky | -Inf | -Inf | -NaN |
| S/N | 27.2 | 46.0 | 51.2 |
| S/N(c) | 0.0 | 0.0 | 0.0 |
| SN(E/C) |
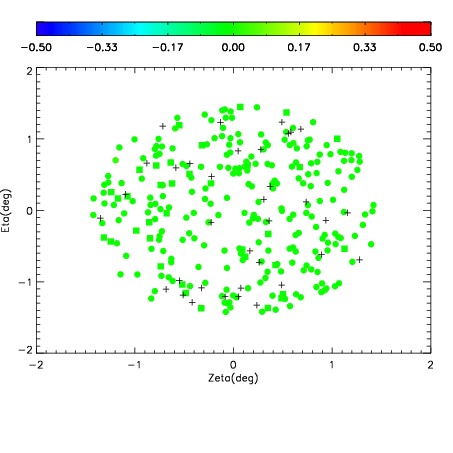
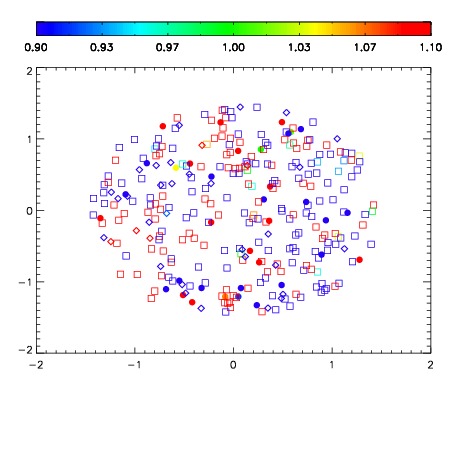
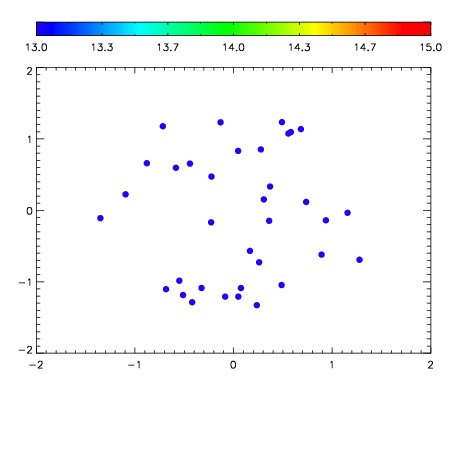

| Frame | Nreads | Zeropoints | Mag plots | Spatial mag deviation | Spatial sky 16325A emission deviations (filled: sky, open: star) | Spatial sky continuum emission | Spatial sky telluric CO2 absorption deviations (filled: H < 10) | |||||||||||||||||||||||
| 0 | 0 |
|
|
|
|
|
|
| IPAIR | NAME | SHIFT | NEWSHIFT | S/N | NAME | SHIFT | NEWSHIFT | S/N |
| 0 | 06150033 | 0.484038 | 0.00000 | 18.2094 | 06150031 | 0.00000 | 0.484038 | 19.0947 |
| 1 | 06150036 | 0.476705 | 0.00733298 | 19.1690 | 06150035 | -0.00235566 | 0.486394 | 19.1643 |
| 2 | 06150037 | 0.478743 | 0.00529501 | 19.1658 | 06150038 | 0.000349860 | 0.483688 | 19.1602 |
| 3 | 06150032 | 0.478199 | 0.00583899 | 18.8211 | 06150034 | -0.00125755 | 0.485296 | 19.1446 |