| Red | Green | Blue | |
| z | 17.64 | ||
| znorm | Inf | ||
| sky | -Inf | -Inf | -Inf |
| S/N | 30.5 | 52.4 | 54.5 |
| S/N(c) | 0.0 | 0.0 | 0.0 |
| SN(E/C) |
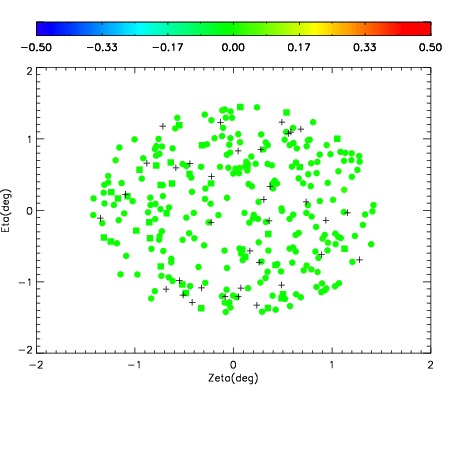
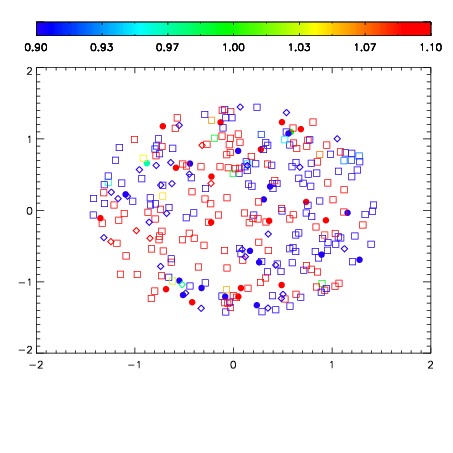
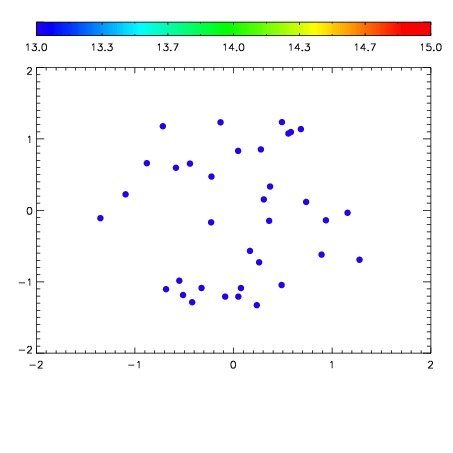

| Frame | Nreads | Zeropoints | Mag plots | Spatial mag deviation | Spatial sky 16325A emission deviations (filled: sky, open: star) | Spatial sky continuum emission | Spatial sky telluric CO2 absorption deviations (filled: H < 10) | |||||||||||||||||||||||
| 0 | 0 |
|
|
|
|
|
|
| IPAIR | NAME | SHIFT | NEWSHIFT | S/N | NAME | SHIFT | NEWSHIFT | S/N |
| 0 | 06440043 | 0.471222 | 0.00000 | 19.1070 | 06440037 | 0.00000 | 0.471222 | 19.1313 |
| 1 | 06440042 | 0.470575 | 0.000647008 | 19.1620 | 06440041 | 4.29072e-05 | 0.471179 | 19.1719 |
| 2 | 06440039 | 0.468724 | 0.00249800 | 19.1490 | 06440040 | -0.00160300 | 0.472825 | 19.1639 |
| 3 | 06440038 | 0.468818 | 0.00240400 | 19.1236 | 06440044 | 0.000142278 | 0.471080 | 19.1513 |