| Red | Green | Blue | |
| z | 17.64 | ||
| znorm | Inf | ||
| sky | -NaN | -Inf | -Inf |
| S/N | 28.8 | 47.2 | 50.8 |
| S/N(c) | 0.0 | 0.0 | 0.0 |
| SN(E/C) |
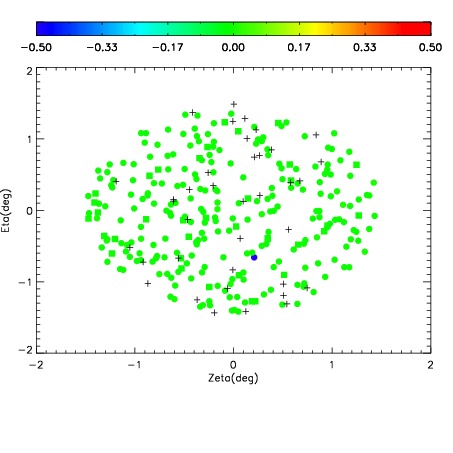
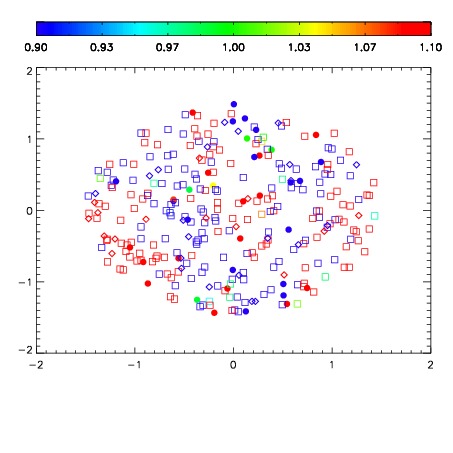
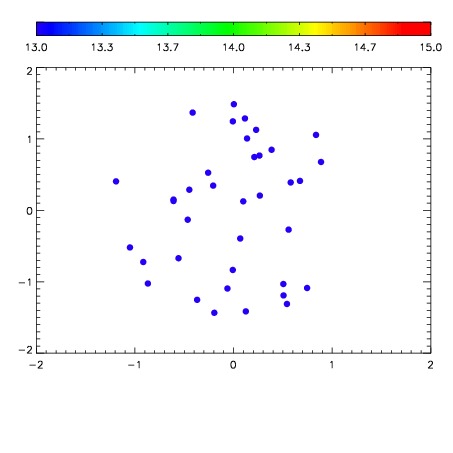

| Frame | Nreads | Zeropoints | Mag plots | Spatial mag deviation | Spatial sky 16325A emission deviations (filled: sky, open: star) | Spatial sky continuum emission | Spatial sky telluric CO2 absorption deviations (filled: H < 10) | |||||||||||||||||||||||
| 0 | 0 |
|
|
|
|
|
|
| IPAIR | NAME | SHIFT | NEWSHIFT | S/N | NAME | SHIFT | NEWSHIFT | S/N |
| 0 | 06400070 | 0.488732 | 0.00000 | 19.0075 | 06400064 | 0.00000 | 0.488732 | 19.0421 |
| 1 | 06400065 | 0.487101 | 0.00163102 | 19.0559 | 06400071 | 0.00413379 | 0.484598 | 19.0983 |
| 2 | 06400069 | 0.488327 | 0.000405014 | 19.0264 | 06400067 | -0.000601605 | 0.489334 | 19.0577 |
| 3 | 06400066 | 0.487022 | 0.00171000 | 19.0103 | 06400068 | -8.88168e-05 | 0.488821 | 19.0557 |