| Red | Green | Blue | |
| z | 17.64 | ||
| znorm | Inf | ||
| sky | -Inf | -Inf | -Inf |
| S/N | 25.1 | 45.4 | 48.1 |
| S/N(c) | 0.0 | 0.0 | 0.0 |
| SN(E/C) |
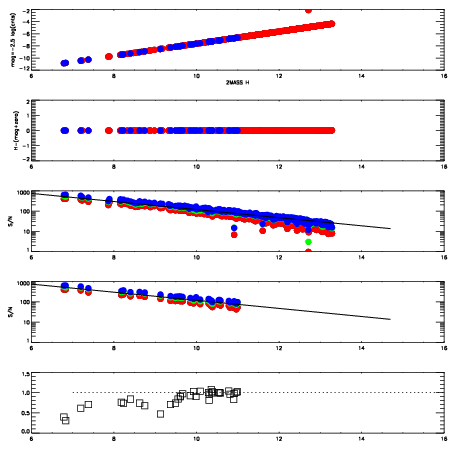
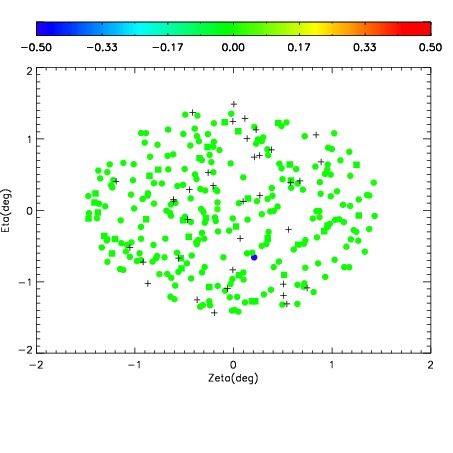
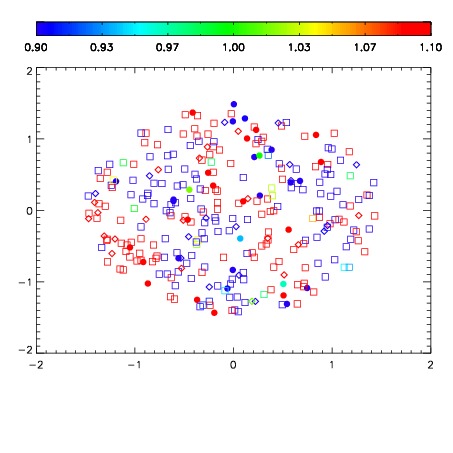


| Frame | Nreads | Zeropoints | Mag plots | Spatial mag deviation | Spatial sky 16325A emission deviations (filled: sky, open: star) | Spatial sky continuum emission | Spatial sky telluric CO2 absorption deviations (filled: H < 10) | |||||||||||||||||||||||
| 0 | 0 |
|
|
|
|
|
|
| IPAIR | NAME | SHIFT | NEWSHIFT | S/N | NAME | SHIFT | NEWSHIFT | S/N |
| 0 | 06630051 | 0.485697 | 0.00000 | 19.0376 | 06630052 | 0.00313085 | 0.482566 | 18.9638 |
| 1 | 06630050 | 0.485219 | 0.000477999 | 19.0167 | 06630049 | -0.00168212 | 0.487379 | 18.8725 |
| 2 | 06630047 | 0.482918 | 0.00277901 | 18.8932 | 06630045 | 0.00000 | 0.485697 | 18.8653 |
| 3 | 06630046 | 0.482381 | 0.00331602 | 18.8631 | 06630048 | 0.00200749 | 0.483690 | 18.8450 |