| Red | Green | Blue | |
| z | 17.64 | ||
| znorm | Inf | ||
| sky | -NaN | -NaN | -Inf |
| S/N | 29.9 | 50.9 | 54.6 |
| S/N(c) | 0.0 | 0.0 | 0.0 |
| SN(E/C) |
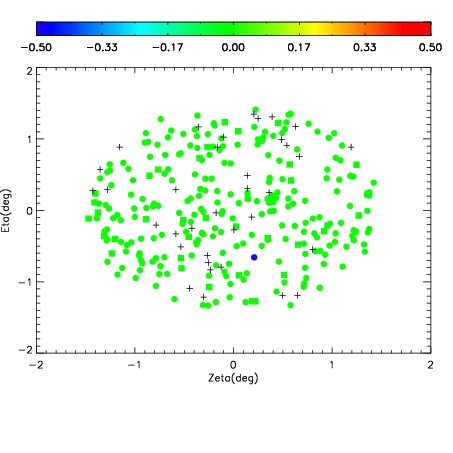
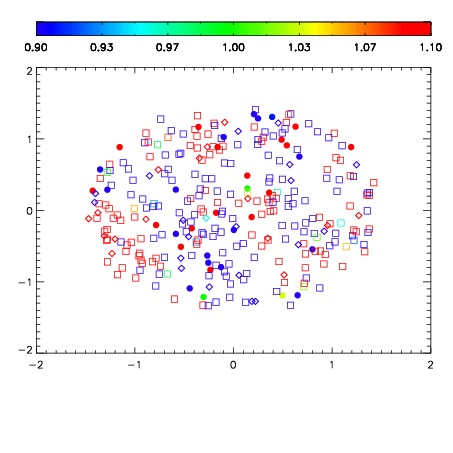


| Frame | Nreads | Zeropoints | Mag plots | Spatial mag deviation | Spatial sky 16325A emission deviations (filled: sky, open: star) | Spatial sky continuum emission | Spatial sky telluric CO2 absorption deviations (filled: H < 10) | |||||||||||||||||||||||
| 0 | 0 |
|
|
|
|
|
|
| IPAIR | NAME | SHIFT | NEWSHIFT | S/N | NAME | SHIFT | NEWSHIFT | S/N |
| 0 | 06380054 | 0.485242 | 0.00000 | 19.1003 | 06380052 | 0.00000 | 0.485242 | 19.0915 |
| 1 | 06380058 | 0.480861 | 0.00438100 | 19.1691 | 06380059 | 0.00164470 | 0.483597 | 19.1648 |
| 2 | 06380057 | 0.481189 | 0.00405300 | 19.1498 | 06380056 | 0.0186443 | 0.466598 | 19.1122 |
| 3 | 06380053 | 0.484674 | 0.000568002 | 19.0413 | 06380055 | 0.00275806 | 0.482484 | 19.0266 |