| Red | Green | Blue | |
| z | 17.64 | ||
| znorm | Inf | ||
| sky | -Inf | -Inf | -Inf |
| S/N | 26.9 | 47.3 | 51.1 |
| S/N(c) | 0.0 | 0.0 | 0.0 |
| SN(E/C) |
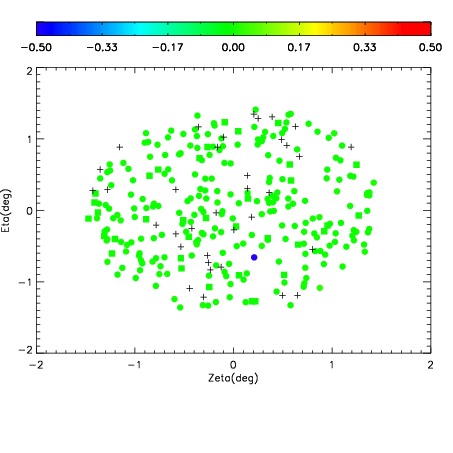
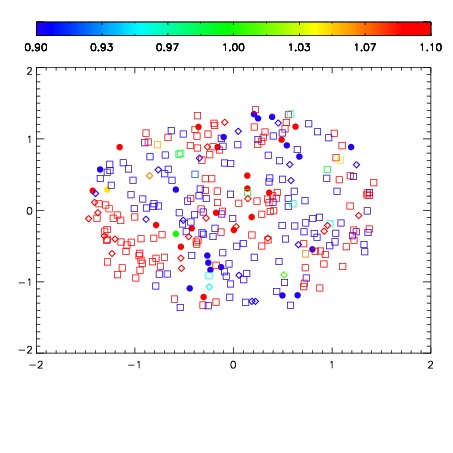
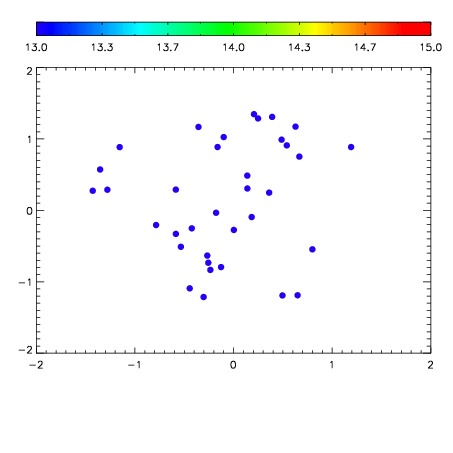

| Frame | Nreads | Zeropoints | Mag plots | Spatial mag deviation | Spatial sky 16325A emission deviations (filled: sky, open: star) | Spatial sky continuum emission | Spatial sky telluric CO2 absorption deviations (filled: H < 10) | |||||||||||||||||||||||
| 0 | 0 |
|
|
|
|
|
|
| IPAIR | NAME | SHIFT | NEWSHIFT | S/N | NAME | SHIFT | NEWSHIFT | S/N |
| 0 | 06420061 | 0.478995 | 0.00000 | 18.3739 | 06420066 | -0.00308306 | 0.482078 | 18.5052 |
| 1 | 06420057 | 0.477763 | 0.00123200 | 18.9743 | 06420058 | -0.00179047 | 0.480785 | 18.9318 |
| 2 | 06420065 | 0.477219 | 0.00177601 | 18.8701 | 06420059 | -0.00118413 | 0.480179 | 18.8897 |
| 3 | 06420056 | 0.478293 | 0.000701994 | 18.8056 | 06420055 | 0.00000 | 0.478995 | 18.8530 |
| 4 | 06420064 | 0.477018 | 0.00197700 | 18.5827 | 06420062 | -0.00243239 | 0.481427 | 18.6784 |
| 5 | 06420060 | 0.478355 | 0.000640005 | 18.3567 | 06420063 | -0.00373340 | 0.482728 | 18.4961 |