| Red | Green | Blue | |
| z | 17.64 | ||
| znorm | Inf | ||
| sky | -Inf | -Inf | -Inf |
| S/N | 14.9 | 27.0 | 29.5 |
| S/N(c) | 0.0 | 0.0 | 0.0 |
| SN(E/C) |
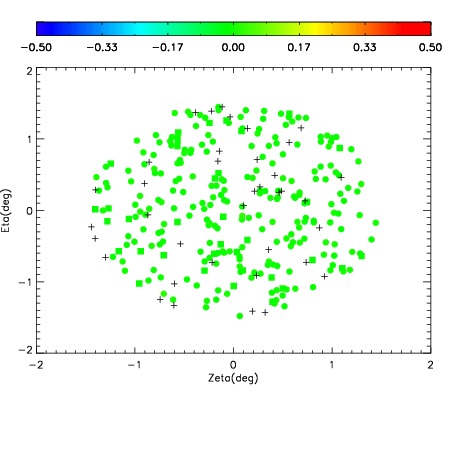


| Frame | Nreads | Zeropoints | Mag plots | Spatial mag deviation | Spatial sky 16325A emission deviations (filled: sky, open: star) | Spatial sky continuum emission | Spatial sky telluric CO2 absorption deviations (filled: H < 10) | |||||||||||||||||||||||
| 0 | 0 |
|
|
|
|
|
|
| IPAIR | NAME | SHIFT | NEWSHIFT | S/N | NAME | SHIFT | NEWSHIFT | S/N |
| 0 | 06330063 | 0.473438 | 0.00000 | 17.5161 | 06330068 | 0.00402253 | 0.469415 | 16.6380 |
| 1 | 06330066 | 0.469898 | 0.00354001 | 18.7465 | 06330061 | 0.00000 | 0.473438 | 18.9912 |
| 2 | 06330062 | 0.472526 | 0.000911981 | 18.5398 | 06330064 | 0.000775048 | 0.472663 | 17.8100 |
| 3 | 06330067 | 0.471003 | 0.00243500 | 16.6552 | 06330065 | 0.00172035 | 0.471718 | 15.5150 |