| Red | Green | Blue | |
| z | 17.64 | ||
| znorm | Inf | ||
| sky | -Inf | -Inf | -Inf |
| S/N | 28.5 | 50.1 | 53.4 |
| S/N(c) | 0.0 | 0.0 | 0.0 |
| SN(E/C) |
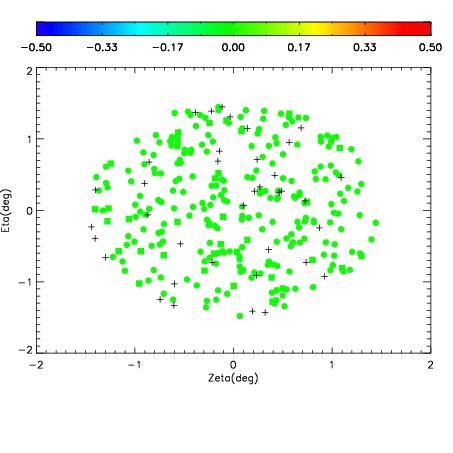
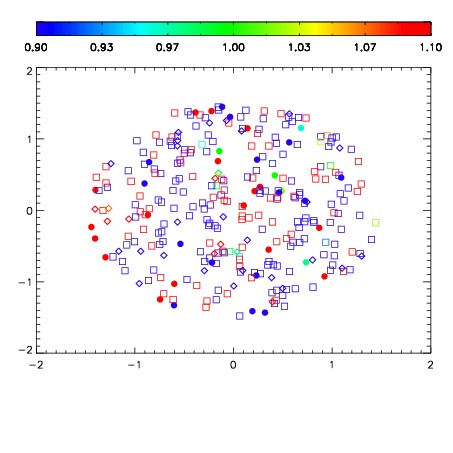


| Frame | Nreads | Zeropoints | Mag plots | Spatial mag deviation | Spatial sky 16325A emission deviations (filled: sky, open: star) | Spatial sky continuum emission | Spatial sky telluric CO2 absorption deviations (filled: H < 10) | |||||||||||||||||||||||
| 0 | 0 |
|
|
|
|
|
|
| IPAIR | NAME | SHIFT | NEWSHIFT | S/N | NAME | SHIFT | NEWSHIFT | S/N |
| 0 | 06380042 | 0.460233 | 0.00000 | 19.1356 | 06380041 | 0.00000 | 0.460233 | 19.0385 |
| 1 | 06380047 | 0.460023 | 0.000210017 | 19.1983 | 06380048 | -0.0192079 | 0.479441 | 19.2171 |
| 2 | 06380046 | 0.459626 | 0.000607014 | 19.1943 | 06380045 | -0.00313767 | 0.463371 | 19.1960 |
| 3 | 06380043 | 0.459987 | 0.000245988 | 19.1632 | 06380044 | -0.0147536 | 0.474987 | 19.1868 |