| Red | Green | Blue | |
| z | 17.64 | ||
| znorm | Inf | ||
| sky | -Inf | -Inf | -Inf |
| S/N | 27.8 | 45.4 | 52.8 |
| S/N(c) | 0.0 | 0.0 | 0.0 |
| SN(E/C) |
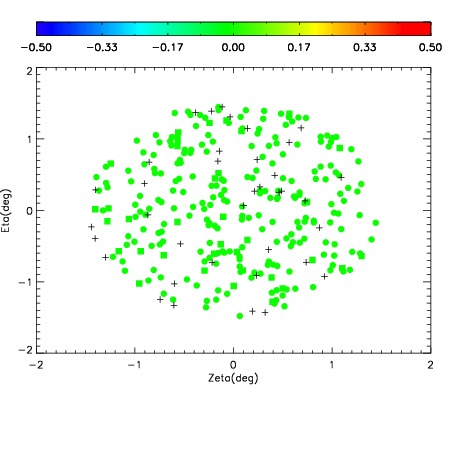
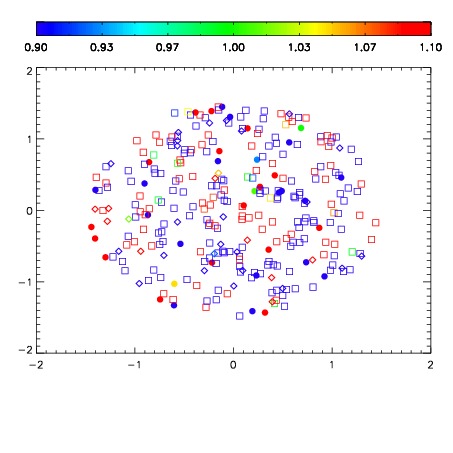


| Frame | Nreads | Zeropoints | Mag plots | Spatial mag deviation | Spatial sky 16325A emission deviations (filled: sky, open: star) | Spatial sky continuum emission | Spatial sky telluric CO2 absorption deviations (filled: H < 10) | |||||||||||||||||||||||
| 0 | 0 |
|
|
|
|
|
|
| IPAIR | NAME | SHIFT | NEWSHIFT | S/N | NAME | SHIFT | NEWSHIFT | S/N |
| 0 | 06610064 | 0.487551 | 0.00000 | 19.1600 | 06610058 | 0.00000 | 0.487551 | 19.0489 |
| 1 | 06610063 | 0.486725 | 0.000826001 | 19.1601 | 06610065 | 0.00335153 | 0.484199 | 19.0611 |
| 2 | 06610059 | 0.484419 | 0.00313202 | 19.1051 | 06610062 | 0.00151225 | 0.486039 | 19.0409 |
| 3 | 06610060 | 0.485420 | 0.00213102 | 19.0939 | 06610061 | 0.00261987 | 0.484931 | 18.9618 |