| Red | Green | Blue | |
| z | 17.64 | ||
| znorm | Inf | ||
| sky | -Inf | -NaN | -Inf |
| S/N | 23.9 | 41.3 | 43.9 |
| S/N(c) | 0.0 | 0.0 | 0.0 |
| SN(E/C) |
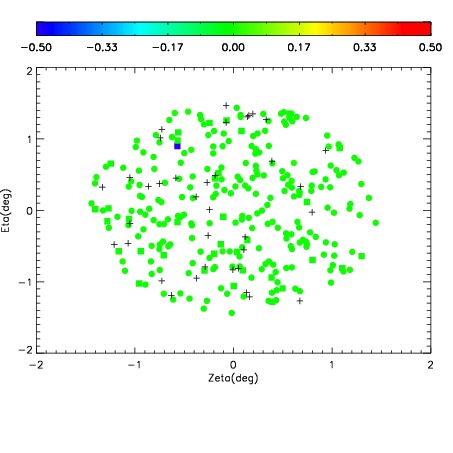
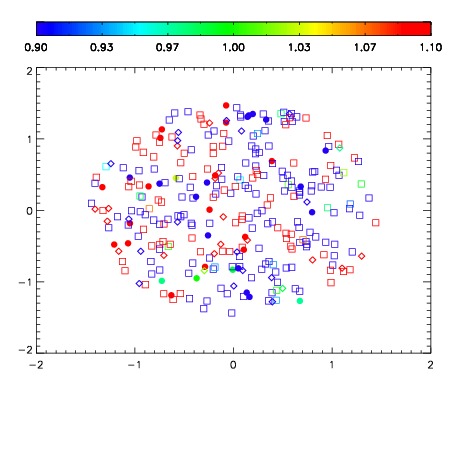


| Frame | Nreads | Zeropoints | Mag plots | Spatial mag deviation | Spatial sky 16325A emission deviations (filled: sky, open: star) | Spatial sky continuum emission | Spatial sky telluric CO2 absorption deviations (filled: H < 10) | |||||||||||||||||||||||
| 0 | 0 |
|
|
|
|
|
|
| IPAIR | NAME | SHIFT | NEWSHIFT | S/N | NAME | SHIFT | NEWSHIFT | S/N |
| 0 | 06340039 | 0.464850 | 0.00000 | 17.4094 | 06340040 | 0.00221124 | 0.462639 | 18.0921 |
| 1 | 06340043 | 0.462691 | 0.00215900 | 19.1839 | 06340044 | -0.00215226 | 0.467002 | 19.2077 |
| 2 | 06340042 | 0.461844 | 0.00300601 | 19.1324 | 06340037 | 0.00000 | 0.464850 | 18.9335 |
| 3 | 06340038 | 0.463588 | 0.00126201 | 19.0358 | 06340041 | 0.00128220 | 0.463568 | 18.8399 |