| Red | Green | Blue | |
| z | 17.64 | ||
| znorm | Inf | ||
| sky | -Inf | -Inf | -Inf |
| S/N | 17.2 | 30.9 | 32.2 |
| S/N(c) | 0.0 | 0.0 | 0.0 |
| SN(E/C) |


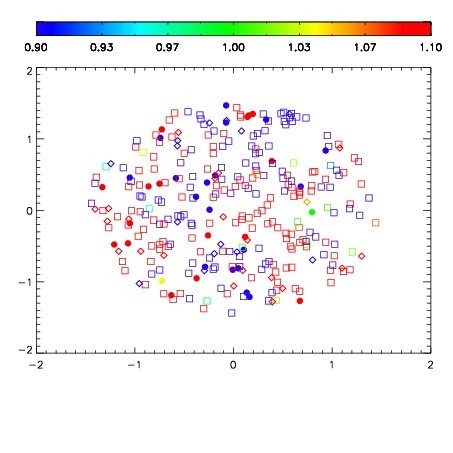


| Frame | Nreads | Zeropoints | Mag plots | Spatial mag deviation | Spatial sky 16325A emission deviations (filled: sky, open: star) | Spatial sky continuum emission | Spatial sky telluric CO2 absorption deviations (filled: H < 10) | |||||||||||||||||||||||
| 0 | 0 |
|
|
|
|
|
|
| IPAIR | NAME | SHIFT | NEWSHIFT | S/N | NAME | SHIFT | NEWSHIFT | S/N |
| 0 | 06400055 | 0.487303 | 0.00000 | 18.4770 | 06400053 | 0.00000 | 0.487303 | 18.5105 |
| 1 | 06400054 | 0.487129 | 0.000173986 | 18.4730 | 06400057 | -0.00173666 | 0.489040 | 18.4543 |
| 2 | 06400058 | 0.486209 | 0.00109398 | 18.4569 | 06400060 | -3.25631e-05 | 0.487336 | 18.3195 |
| 3 | 06400059 | 0.487046 | 0.000256985 | 18.2269 | 06400056 | -0.000200935 | 0.487504 | 18.2329 |