| Red | Green | Blue | |
| z | 17.64 | ||
| znorm | Inf | ||
| sky | -Inf | -Inf | -Inf |
| S/N | 24.6 | 44.0 | 48.8 |
| S/N(c) | 0.0 | 0.0 | 0.0 |
| SN(E/C) |
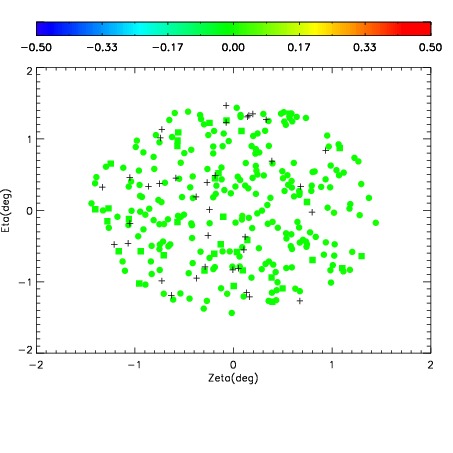

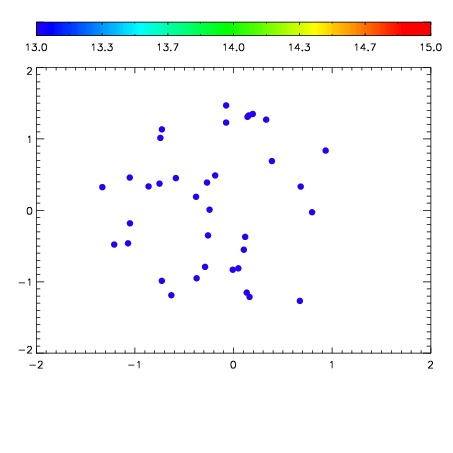

| Frame | Nreads | Zeropoints | Mag plots | Spatial mag deviation | Spatial sky 16325A emission deviations (filled: sky, open: star) | Spatial sky continuum emission | Spatial sky telluric CO2 absorption deviations (filled: H < 10) | |||||||||||||||||||||||
| 0 | 0 |
|
|
|
|
|
|
| IPAIR | NAME | SHIFT | NEWSHIFT | S/N | NAME | SHIFT | NEWSHIFT | S/N |
| 0 | 06620067 | 0.476698 | 0.00000 | 17.7015 | 06620065 | 0.00421529 | 0.472483 | 18.3255 |
| 1 | 06620060 | 0.474177 | 0.00252101 | 19.1502 | 06620058 | -0.00447864 | 0.481177 | 19.0231 |
| 2 | 06620059 | 0.474627 | 0.00207102 | 19.1281 | 06620057 | -0.000675820 | 0.477374 | 18.9575 |
| 3 | 06620063 | 0.474897 | 0.00180101 | 18.4047 | 06620061 | -0.000100942 | 0.476799 | 18.7867 |
| 4 | 06620064 | 0.475333 | 0.00136501 | 18.0583 | 06620062 | -0.00315222 | 0.479850 | 18.7318 |
| 5 | 06620056 | 0.474889 | 0.00180900 | 17.0957 | 06620066 | 0.00732719 | 0.469371 | 17.6875 |
| 6 | 06620055 | 0.475842 | 0.000856012 | 15.8042 | 06620054 | 0.00000 | 0.476698 | 17.6397 |