| Red | Green | Blue | |
| z | 17.64 | ||
| znorm | Inf | ||
| sky | -Inf | -Inf | -Inf |
| S/N | 24.3 | 39.9 | 43.1 |
| S/N(c) | 0.0 | 0.0 | 0.0 |
| SN(E/C) |
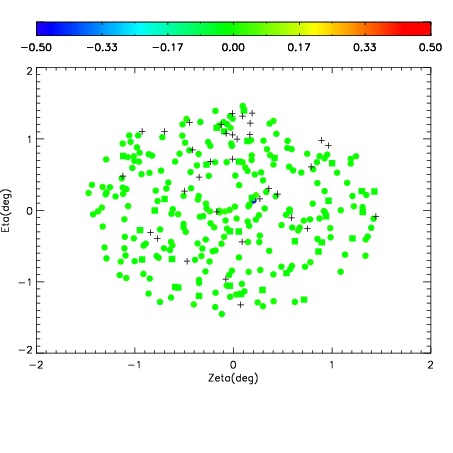
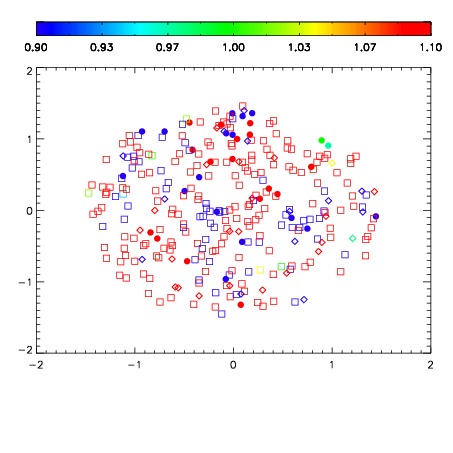


| Frame | Nreads | Zeropoints | Mag plots | Spatial mag deviation | Spatial sky 16325A emission deviations (filled: sky, open: star) | Spatial sky continuum emission | Spatial sky telluric CO2 absorption deviations (filled: H < 10) | |||||||||||||||||||||||
| 0 | 0 |
|
|
|
|
|
|
| IPAIR | NAME | SHIFT | NEWSHIFT | S/N | NAME | SHIFT | NEWSHIFT | S/N |
| 0 | 07020028 | 0.480523 | 0.00000 | 18.8161 | 07020026 | 0.00000 | 0.480523 | 18.8610 |
| 1 | 07020032 | 0.476837 | 0.00368598 | 18.9346 | 07020030 | 0.000451087 | 0.480072 | 18.9385 |
| 2 | 07020031 | 0.476340 | 0.00418299 | 18.9300 | 07020029 | 0.00249921 | 0.478024 | 18.9101 |
| 3 | 07020027 | 0.479597 | 0.000925988 | 18.8761 | 07020033 | 0.00416350 | 0.476359 | 18.9015 |