| Red | Green | Blue | |
| z | 17.64 | ||
| znorm | Inf | ||
| sky | -Inf | -Inf | -Inf |
| S/N | 26.7 | 44.1 | 50.6 |
| S/N(c) | 0.0 | 0.0 | 0.0 |
| SN(E/C) |
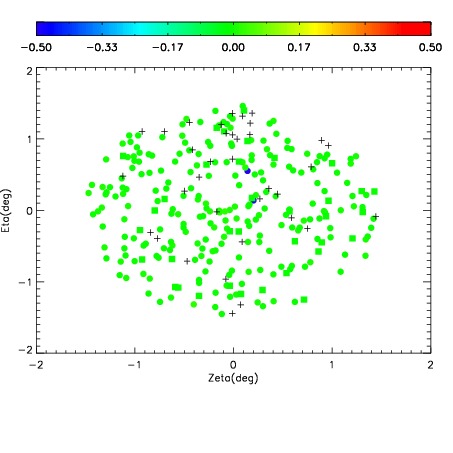

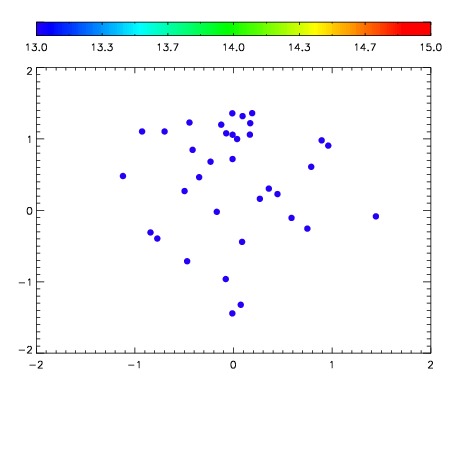

| Frame | Nreads | Zeropoints | Mag plots | Spatial mag deviation | Spatial sky 16325A emission deviations (filled: sky, open: star) | Spatial sky continuum emission | Spatial sky telluric CO2 absorption deviations (filled: H < 10) | |||||||||||||||||||||||
| 0 | 0 |
|
|
|
|
|
|
| IPAIR | NAME | SHIFT | NEWSHIFT | S/N | NAME | SHIFT | NEWSHIFT | S/N |
| 0 | 07210038 | 0.481303 | 0.00000 | 19.0029 | 07210040 | -0.000470807 | 0.481774 | 18.9974 |
| 1 | 07210039 | 0.481041 | 0.000261992 | 18.9971 | 07210037 | 0.00000 | 0.481303 | 18.9450 |
| 2 | 07210042 | 0.478189 | 0.00311401 | 18.9173 | 07210044 | -0.000610915 | 0.481914 | 18.8621 |
| 3 | 07210043 | 0.479266 | 0.00203702 | 18.9129 | 07210041 | -0.00168310 | 0.482986 | 18.8315 |