| Red | Green | Blue | |
| z | 17.64 | ||
| znorm | Inf | ||
| sky | -NaN | -NaN | -NaN |
| S/N | 31.1 | 52.5 | 56.0 |
| S/N(c) | 0.0 | 0.0 | 0.0 |
| SN(E/C) |

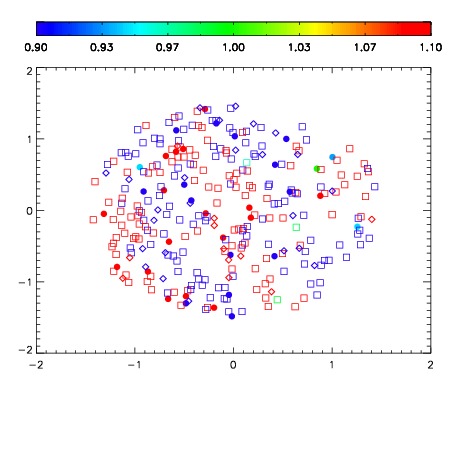
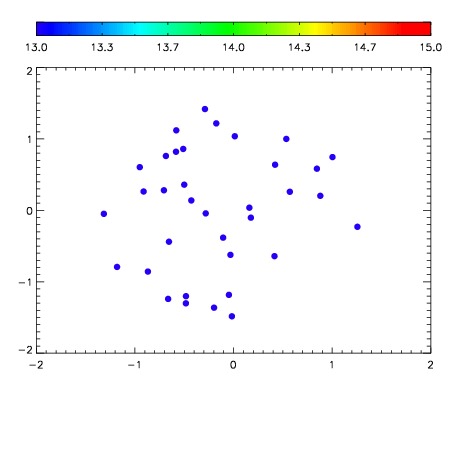

| Frame | Nreads | Zeropoints | Mag plots | Spatial mag deviation | Spatial sky 16325A emission deviations (filled: sky, open: star) | Spatial sky continuum emission | Spatial sky telluric CO2 absorption deviations (filled: H < 10) | |||||||||||||||||||||||
| 0 | 0 |
|
|
|
|
|
|
| IPAIR | NAME | SHIFT | NEWSHIFT | S/N | NAME | SHIFT | NEWSHIFT | S/N |
| 0 | 06430027 | 0.487487 | 0.00000 | 19.2239 | 06430024 | -0.000209990 | 0.487697 | 19.2348 |
| 1 | 06430026 | 0.487115 | 0.000371993 | 19.2357 | 06430025 | -0.000869654 | 0.488357 | 19.2455 |
| 2 | 06430022 | 0.483801 | 0.00368598 | 19.2287 | 06430028 | 0.000726527 | 0.486760 | 19.2390 |
| 3 | 06430023 | 0.483818 | 0.00366899 | 19.2114 | 06430021 | 0.00000 | 0.487487 | 19.1943 |