| Red | Green | Blue | |
| z | 17.64 | ||
| znorm | Inf | ||
| sky | -Inf | -NaN | -Inf |
| S/N | 33.2 | 56.5 | 60.9 |
| S/N(c) | 0.0 | 0.0 | 0.0 |
| SN(E/C) |
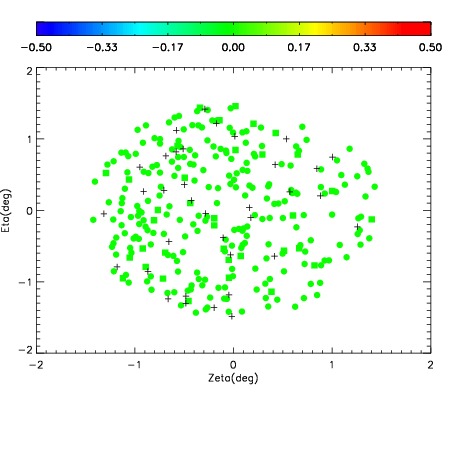
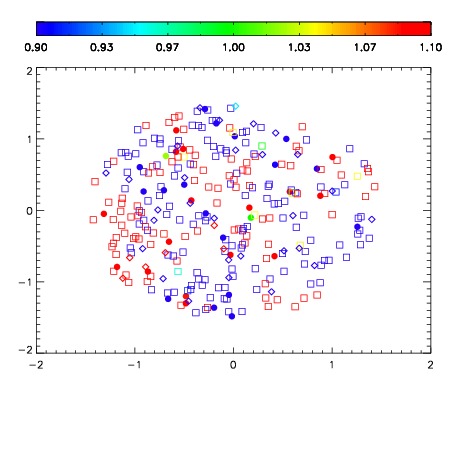


| Frame | Nreads | Zeropoints | Mag plots | Spatial mag deviation | Spatial sky 16325A emission deviations (filled: sky, open: star) | Spatial sky continuum emission | Spatial sky telluric CO2 absorption deviations (filled: H < 10) | |||||||||||||||||||||||
| 0 | 0 |
|
|
|
|
|
|
| IPAIR | NAME | SHIFT | NEWSHIFT | S/N | NAME | SHIFT | NEWSHIFT | S/N |
| 0 | 06590038 | 0.466879 | 0.00000 | 19.0770 | 06590039 | -0.00334936 | 0.470228 | 19.0473 |
| 1 | 06590037 | 0.466014 | 0.000865012 | 19.1029 | 06590040 | 0.000614943 | 0.466264 | 19.1075 |
| 2 | 06590042 | 0.465280 | 0.00159901 | 19.1000 | 06590047 | -0.00356639 | 0.470445 | 19.1071 |
| 3 | 06590041 | 0.464322 | 0.00255701 | 19.0965 | 06590043 | 0.00588877 | 0.460990 | 19.1052 |
| 4 | 06590046 | 0.464198 | 0.00268102 | 19.0701 | 06590036 | 0.00000 | 0.466879 | 19.0097 |
| 5 | 06590045 | 0.464503 | 0.00237602 | 18.9654 | 06590044 | 0.00384272 | 0.463036 | 18.8267 |