| Red | Green | Blue | |
| z | 17.64 | ||
| znorm | Inf | ||
| sky | -Inf | -NaN | -Inf |
| S/N | 27.7 | 47.3 | 51.0 |
| S/N(c) | 0.0 | 0.0 | 0.0 |
| SN(E/C) |
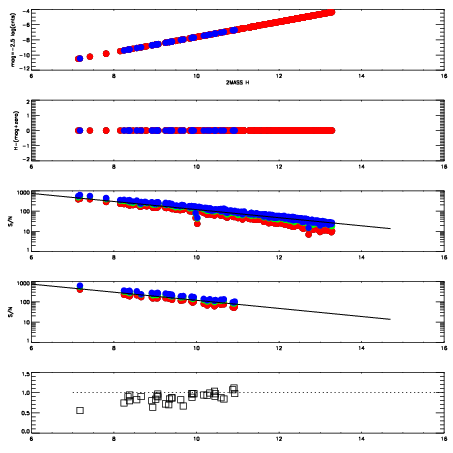
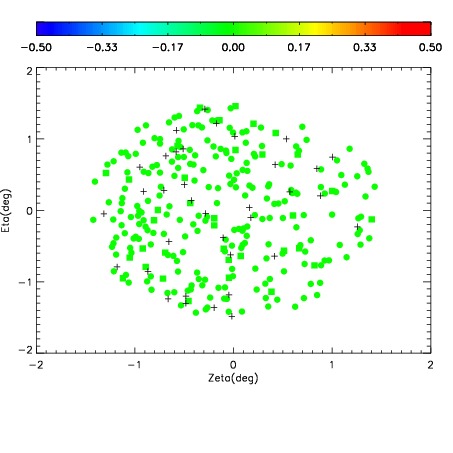
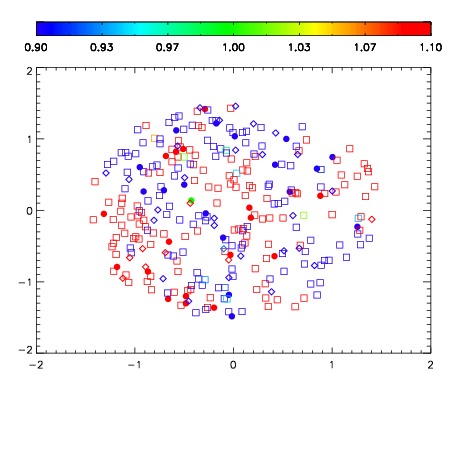
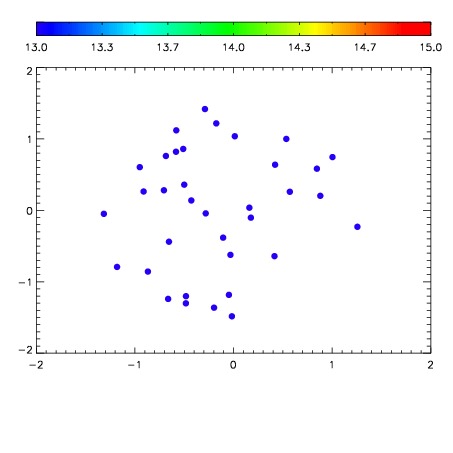

| Frame | Nreads | Zeropoints | Mag plots | Spatial mag deviation | Spatial sky 16325A emission deviations (filled: sky, open: star) | Spatial sky continuum emission | Spatial sky telluric CO2 absorption deviations (filled: H < 10) | |||||||||||||||||||||||
| 0 | 0 |
|
|
|
|
|
|
| IPAIR | NAME | SHIFT | NEWSHIFT | S/N | NAME | SHIFT | NEWSHIFT | S/N |
| 0 | 06690031 | 0.484981 | 0.00000 | 19.0439 | 06690033 | -0.00285533 | 0.487836 | 19.0290 |
| 1 | 06690030 | 0.484478 | 0.000503004 | 19.0859 | 06690029 | 0.00000 | 0.484981 | 19.0353 |
| 2 | 06690035 | 0.483151 | 0.00183001 | 19.0298 | 06690036 | -0.00361444 | 0.488595 | 19.0244 |
| 3 | 06690034 | 0.482724 | 0.00225699 | 19.0202 | 06690032 | -0.00367333 | 0.488654 | 19.0099 |