| Red | Green | Blue | |
| z | 17.64 | ||
| znorm | Inf | ||
| sky | -Inf | -Inf | -Inf |
| S/N | 28.9 | 47.0 | 52.1 |
| S/N(c) | 0.0 | 0.0 | 0.0 |
| SN(E/C) |
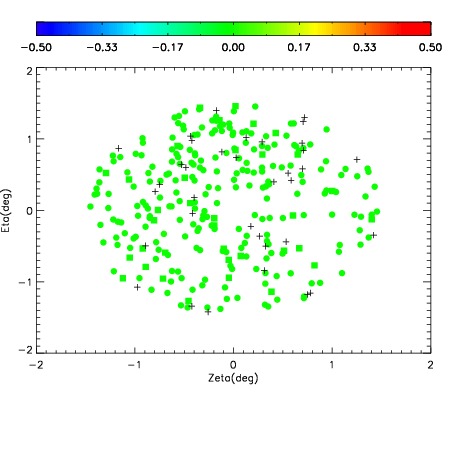
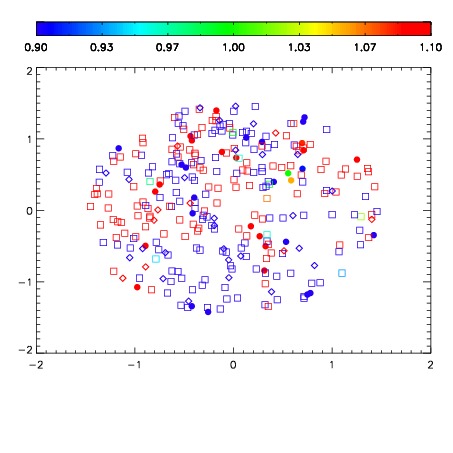
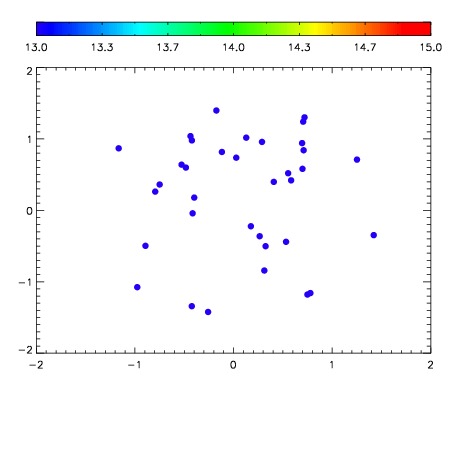

| Frame | Nreads | Zeropoints | Mag plots | Spatial mag deviation | Spatial sky 16325A emission deviations (filled: sky, open: star) | Spatial sky continuum emission | Spatial sky telluric CO2 absorption deviations (filled: H < 10) | |||||||||||||||||||||||
| 0 | 0 |
|
|
|
|
|
|
| IPAIR | NAME | SHIFT | NEWSHIFT | S/N | NAME | SHIFT | NEWSHIFT | S/N |
| 0 | 06440013 | 0.470629 | 0.00000 | 19.1704 | 06440018 | -0.00769596 | 0.478325 | 19.1951 |
| 1 | 06440012 | 0.470326 | 0.000303000 | 19.1607 | 06440011 | 0.00000 | 0.470629 | 19.1877 |
| 2 | 06440017 | 0.469792 | 0.000836998 | 19.1511 | 06440014 | -0.00710038 | 0.477729 | 19.1737 |
| 3 | 06440016 | 0.469345 | 0.00128400 | 19.1447 | 06440015 | -0.00596760 | 0.476597 | 19.1683 |