| Red | Green | Blue | |
| z | 17.64 | ||
| znorm | Inf | ||
| sky | -Inf | -NaN | -Inf |
| S/N | 28.5 | 47.9 | 51.4 |
| S/N(c) | 0.0 | 0.0 | 0.0 |
| SN(E/C) |


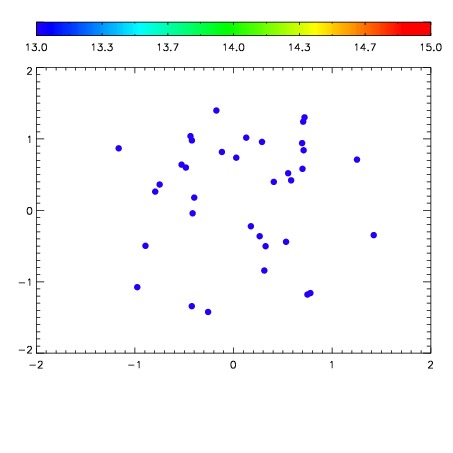

| Frame | Nreads | Zeropoints | Mag plots | Spatial mag deviation | Spatial sky 16325A emission deviations (filled: sky, open: star) | Spatial sky continuum emission | Spatial sky telluric CO2 absorption deviations (filled: H < 10) | |||||||||||||||||||||||
| 0 | 0 |
|
|
|
|
|
|
| IPAIR | NAME | SHIFT | NEWSHIFT | S/N | NAME | SHIFT | NEWSHIFT | S/N |
| 0 | 06610042 | 0.484694 | 0.00000 | 19.1388 | 06610043 | 0.00167210 | 0.483022 | 19.1034 |
| 1 | 06610038 | 0.484137 | 0.000557005 | 19.1870 | 06610040 | -0.000826419 | 0.485520 | 19.1911 |
| 2 | 06610037 | 0.483431 | 0.00126299 | 19.1811 | 06610036 | 0.00000 | 0.484694 | 19.1865 |
| 3 | 06610041 | 0.483635 | 0.00105900 | 19.1685 | 06610039 | 0.00316378 | 0.481530 | 19.1659 |