| Red | Green | Blue | |
| z | 17.64 | ||
| znorm | Inf | ||
| sky | -NaN | -Inf | -Inf |
| S/N | 24.9 | 40.7 | 44.0 |
| S/N(c) | 0.0 | 0.0 | 0.0 |
| SN(E/C) |
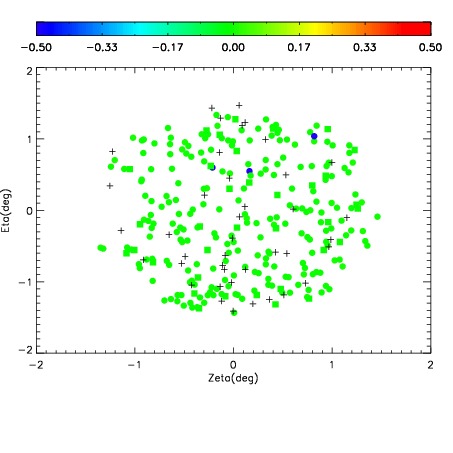
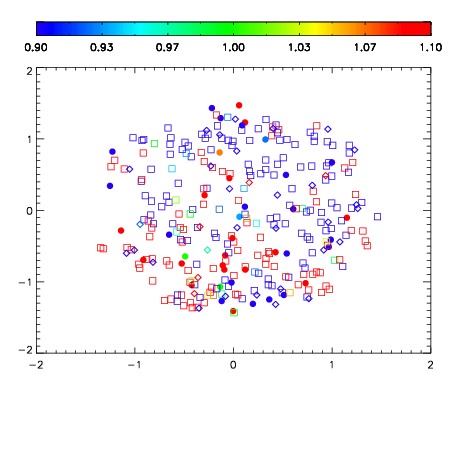
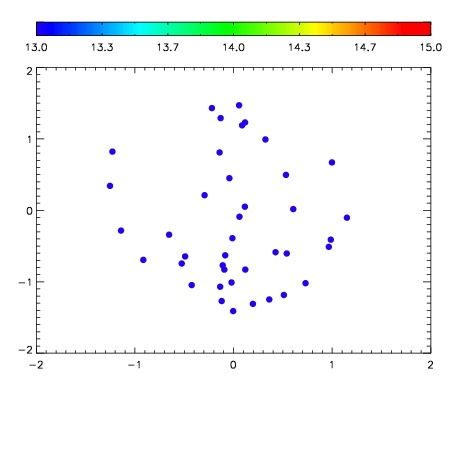

| Frame | Nreads | Zeropoints | Mag plots | Spatial mag deviation | Spatial sky 16325A emission deviations (filled: sky, open: star) | Spatial sky continuum emission | Spatial sky telluric CO2 absorption deviations (filled: H < 10) | |||||||||||||||||||||||
| 0 | 0 |
|
|
|
|
|
|
| IPAIR | NAME | SHIFT | NEWSHIFT | S/N | NAME | SHIFT | NEWSHIFT | S/N |
| 0 | 06660053 | 0.486970 | 0.00000 | 19.0397 | 06660054 | 0.000631515 | 0.486338 | 19.0393 |
| 1 | 06660052 | 0.486710 | 0.000259995 | 19.0944 | 06660050 | 3.97965e-05 | 0.486930 | 19.0758 |
| 2 | 06660049 | 0.485700 | 0.00127000 | 19.0674 | 06660051 | -0.000679016 | 0.487649 | 19.0607 |
| 3 | 06660048 | 0.486054 | 0.000916004 | 19.0228 | 06660047 | 0.00000 | 0.486970 | 19.0195 |