| Red | Green | Blue | |
| z | 17.64 | ||
| znorm | Inf | ||
| sky | -NaN | -NaN | -Inf |
| S/N | 26.5 | 45.2 | 48.5 |
| S/N(c) | 0.0 | 0.0 | 0.0 |
| SN(E/C) |
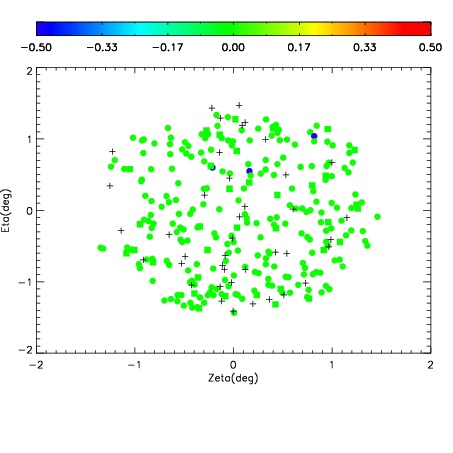
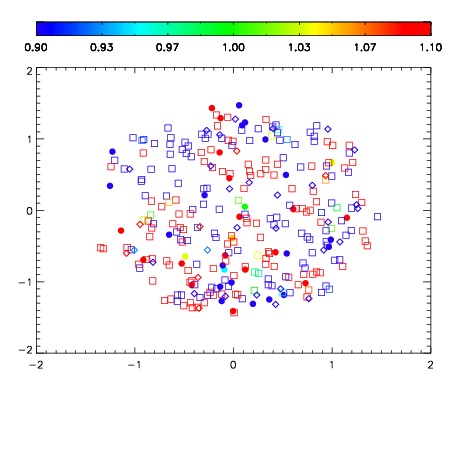
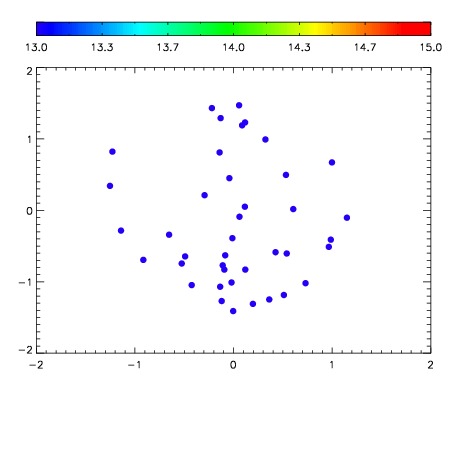

| Frame | Nreads | Zeropoints | Mag plots | Spatial mag deviation | Spatial sky 16325A emission deviations (filled: sky, open: star) | Spatial sky continuum emission | Spatial sky telluric CO2 absorption deviations (filled: H < 10) | |||||||||||||||||||||||
| 0 | 0 |
|
|
|
|
|
|
| IPAIR | NAME | SHIFT | NEWSHIFT | S/N | NAME | SHIFT | NEWSHIFT | S/N |
| 0 | 06700047 | 0.487531 | 0.00000 | 19.0954 | 06700045 | 0.00398510 | 0.483546 | 19.0641 |
| 1 | 06700046 | 0.486630 | 0.000901014 | 19.1101 | 06700048 | 0.00451139 | 0.483020 | 19.1295 |
| 2 | 06700042 | 0.485590 | 0.00194100 | 19.1038 | 06700044 | 0.00151913 | 0.486012 | 19.0810 |
| 3 | 06700043 | 0.485440 | 0.00209102 | 19.0320 | 06700041 | 0.00000 | 0.487531 | 19.0592 |