| Red | Green | Blue | |
| z | 17.64 | ||
| znorm | Inf | ||
| sky | -Inf | -NaN | -Inf |
| S/N | 31.6 | 49.1 | 55.3 |
| S/N(c) | 0.0 | 0.0 | 0.0 |
| SN(E/C) |

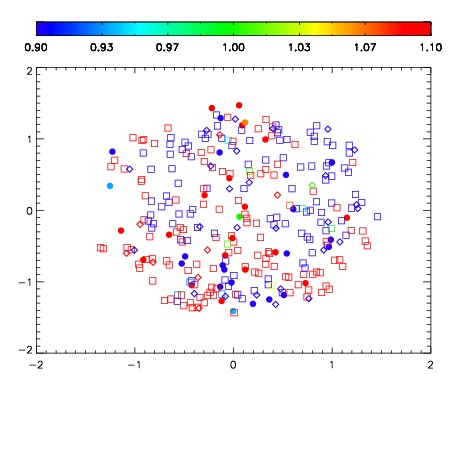


| Frame | Nreads | Zeropoints | Mag plots | Spatial mag deviation | Spatial sky 16325A emission deviations (filled: sky, open: star) | Spatial sky continuum emission | Spatial sky telluric CO2 absorption deviations (filled: H < 10) | |||||||||||||||||||||||
| 0 | 0 |
|
|
|
|
|
|
| IPAIR | NAME | SHIFT | NEWSHIFT | S/N | NAME | SHIFT | NEWSHIFT | S/N |
| 0 | 06930044 | 0.499491 | 0.00000 | 19.0803 | 06930041 | 0.00638484 | 0.493106 | 19.0685 |
| 1 | 06930047 | 0.498958 | 0.000533015 | 19.1292 | 06930038 | 0.00000 | 0.499491 | 19.1712 |
| 2 | 06930040 | 0.498811 | 0.000680000 | 19.1269 | 06930042 | 0.00159264 | 0.497898 | 19.1131 |
| 3 | 06930043 | 0.499255 | 0.000236005 | 19.0915 | 06930045 | 0.00404632 | 0.495445 | 19.0993 |
| 4 | 06930039 | 0.498226 | 0.00126502 | 19.0914 | 06930046 | 0.00168825 | 0.497803 | 19.0884 |