| Red | Green | Blue | |
| z | 17.64 | ||
| znorm | Inf | ||
| sky | -Inf | -Inf | -Inf |
| S/N | 26.9 | 43.9 | 46.6 |
| S/N(c) | 0.0 | 0.0 | 0.0 |
| SN(E/C) |
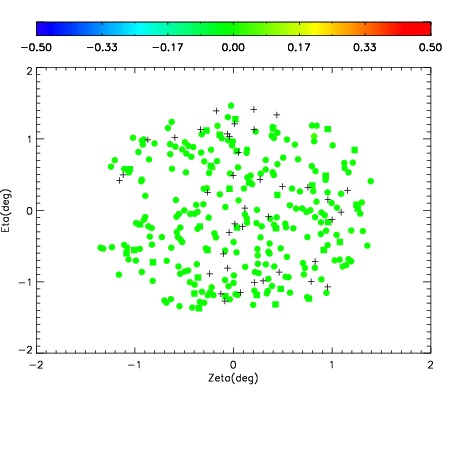
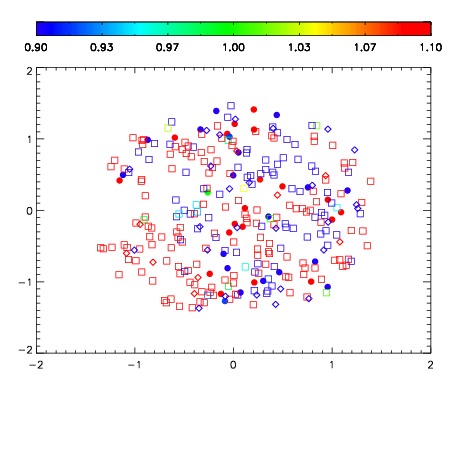


| Frame | Nreads | Zeropoints | Mag plots | Spatial mag deviation | Spatial sky 16325A emission deviations (filled: sky, open: star) | Spatial sky continuum emission | Spatial sky telluric CO2 absorption deviations (filled: H < 10) | |||||||||||||||||||||||
| 0 | 0 |
|
|
|
|
|
|
| IPAIR | NAME | SHIFT | NEWSHIFT | S/N | NAME | SHIFT | NEWSHIFT | S/N |
| 0 | 06670054 | 0.474794 | 0.00000 | 19.0389 | 06670052 | -0.000866203 | 0.475660 | 19.0257 |
| 1 | 06670053 | 0.474452 | 0.000342011 | 19.0434 | 06670055 | -0.000579370 | 0.475373 | 19.0669 |
| 2 | 06670050 | 0.474711 | 8.29995e-05 | 19.0100 | 06670051 | 0.00155221 | 0.473242 | 19.0208 |
| 3 | 06670049 | 0.474185 | 0.000609010 | 18.9736 | 06670048 | 0.00000 | 0.474794 | 18.9707 |